Full Report
The numbers behind PT Saratoga Investama Sedaya Tbk: as-reported financial statements and company metrics for FY2021–FY2025, traced to the source filings, opened with the share-price history those statements have to justify. Every linked figure opens the exact page of the filing it was printed on, with the statement row highlighted. Amounts in IDR millions unless noted.
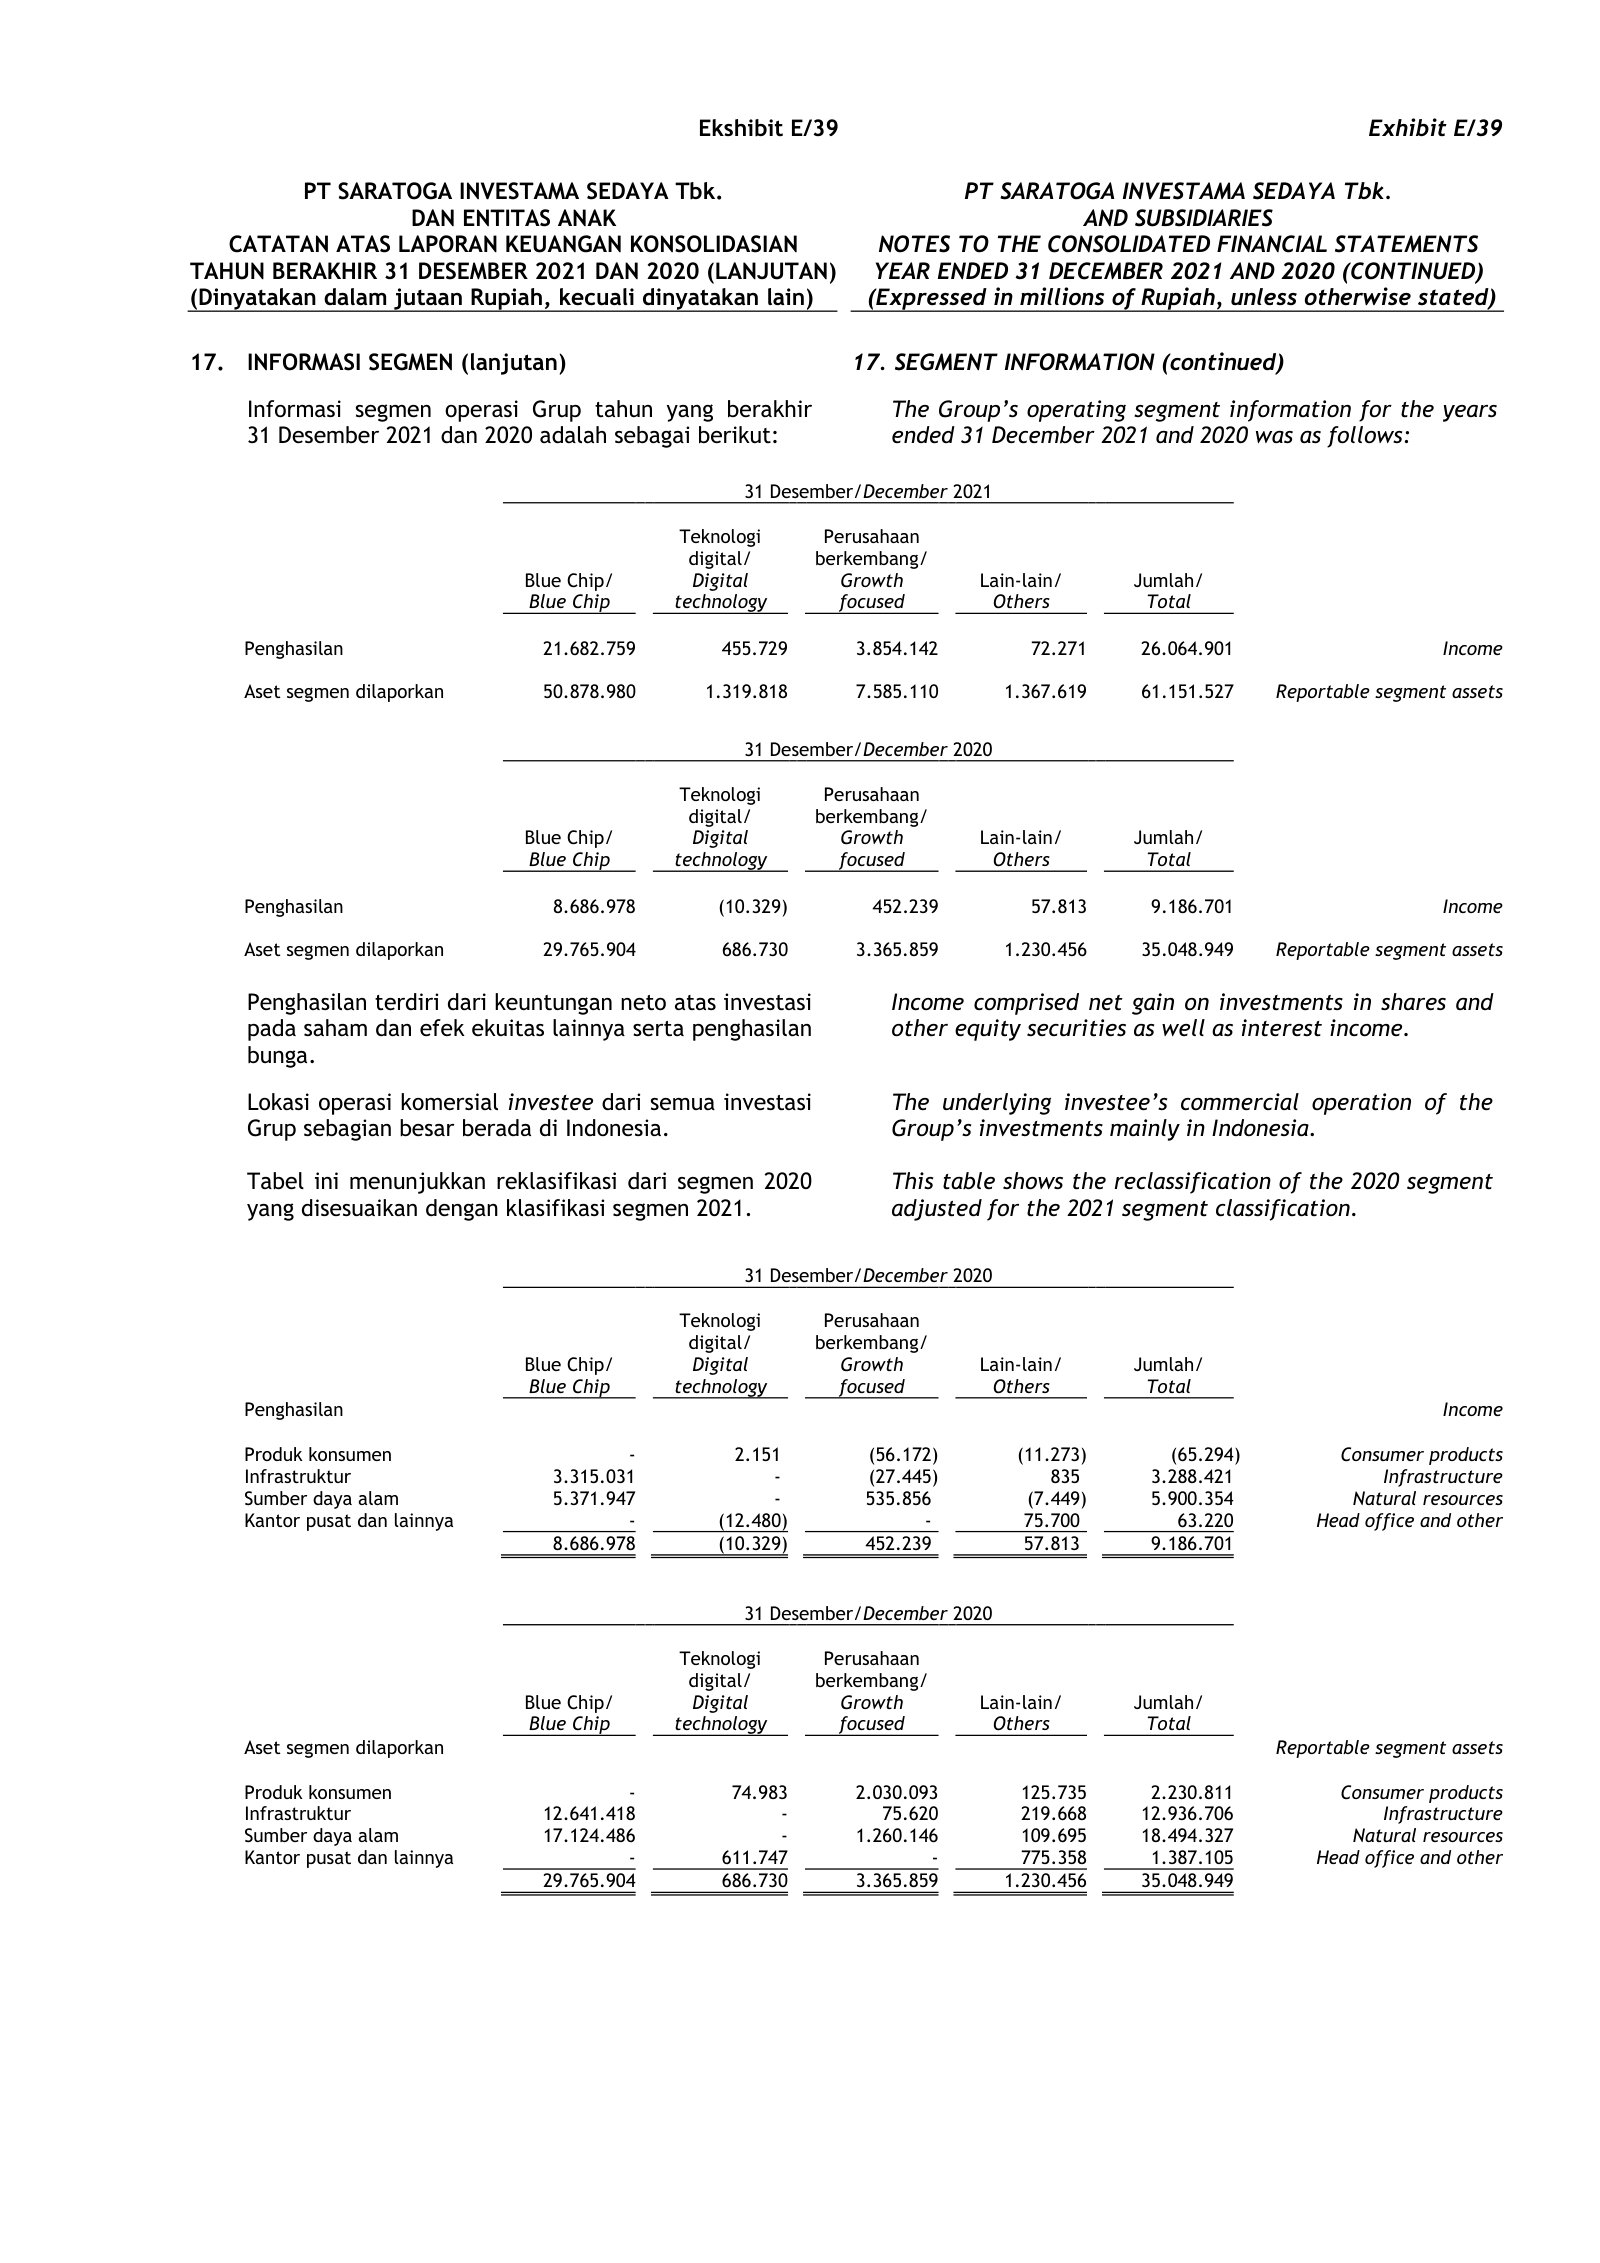
Reading notes: Saratoga Investama Sedaya is an investment holding company: it has no operating revenue line. The tab's revenue breakdown is the company's own reported segment disclosure - Income (loss), defined in the note as net gain (loss) on investments in shares and other securities plus dividend and interest income - which is negative in loss years such as FY2023. All figures are in millions of Rupiah, the unit the audited statements are printed in ('Expressed in millions of Rupiah, unless otherwise stated'). Earnings per share are in whole Rupiah as printed. FY2021-FY2025 statement figures are each taken from that year's own annual report (audited consolidated financial statements, Exhibits A-D). FY2016-FY2020 figures in the long-term record come from the standardized data feed and carry no page links, except FY2020, which is cited to the comparative column of the FY2021 annual report. Segment definitions changed in the FY2021 filing: the pre-2021 scheme (Infrastructure / Natural resources / Consumer products / Head office and others) was replaced wholesale by Blue Chip / Digital technology / Growth focused / Others. The FY2021 annual report prints a bridge restating FY2020 onto the new scheme, so FY2020 is comparable; FY2016-FY2019 long-term totals are sums of the old-scheme segments and are shown without page links.
Share Price — Available History Since January 2026
The stock closed at IDR 1,760 on Jul 27, 2026 — down 4% over the window shown, trading between IDR 1,250 and IDR 2,010. At that close the stock trades at 3.3× FY2025 diluted EPS as reported below.
Source: market price feed, daily closes, Jan 2026–Jul 2026 — the feed marks this available history as partial. Price return only, excludes dividends.
FY2025 at a Glance
Diluted EPS
Source: FY2025 consolidated statements [1] [2] [3] [4]. Click any linked figure to open the filing page with the row highlighted.
Income (Loss) by Segment
| Income (Loss) by Segment | FY2021 | FY2022 | FY2023 | FY2024 | FY2025 |
|---|---|---|---|---|---|
| Blue Chip | 21,682,759 | 6,378,796 | (11,095,896) | 5,848,803 | 5,583,992 |
| Digital technology | 455,729 | (237,294) | (71,730) | (265,765) | (299,539) |
| Growth focused | 3,854,142 | 139,609 | 155,056 | (287,986) | 1,498,309 |
| Others | 72,271 | 57,563 | 9,535 | 32,238 | 223,757 |
| Total income (loss) | 26,064,901 | 6,338,674 | (11,003,035) | 5,327,290 | 7,006,519 |
Source: Notes to the consolidated financial statements — Segment Information. Segment income is net gain (loss) on investments in shares and other securities plus dividend and interest income. [5] [6] [7] [8]. Click any linked figure to open the filing page with the row highlighted.
Income Statement
Source: Consolidated Statements of Profit or Loss and Other Comprehensive Income (audited), as printed in each year's annual report. [1] [2] [3] [4]. Click any linked figure to open the filing page with the row highlighted.
Columns marked E are consensus analyst estimates from S&P Capital IQ (CapIQ), shown alongside reported results for direct comparison; they are not company guidance.
Estimate source: S&P Capital IQ (CapIQ) consensus, as of 2026-07-28. Estimate figures are S&P Capital IQ consensus (vendor data — no filing page links). EPS and net income use the normalized (adjusted) consensus where the street reports it.
Balance Sheet
Source: Consolidated Statements of Financial Position (audited). Saratoga presents an unclassified balance sheet — no current / non-current subtotals and no split of borrowings between current and long-term. [9] [10] [11] [12]. Click any linked figure to open the filing page with the row highlighted.
Cash Flow
Source: Consolidated Statements of Cash Flows (audited). Saratoga reports operating cash flows by the direct method; in FY2021-FY2023 capital expenditure and the investing subtotal are printed as a single combined line. [13] [14] [15] [16]. Click any linked figure to open the filing page with the row highlighted.
Reportable Segment Assets
| Reportable Segment Assets | FY2021 | FY2022 | FY2023 | FY2024 | FY2025 |
|---|---|---|---|---|---|
| Blue Chip | 50,878,980 | 54,699,022 | 41,213,477 | 45,517,065 | 48,735,010 |
| Digital technology | 1,319,818 | 1,262,781 | 1,177,199 | 933,841 | 716,151 |
| Growth focused | 7,585,110 | 6,157,859 | 6,394,939 | 7,392,667 | 9,459,953 |
| Others | 1,367,619 | 1,651,488 | 2,159,505 | 3,998,284 | 3,599,728 |
| Total segment assets | 61,151,527 | 63,771,150 | 50,945,120 | 57,841,857 | 62,510,842 |
Source: Notes to the consolidated financial statements — Segment Information. [5] [6] [7] [8]. Click any linked figure to open the filing page with the row highlighted.
Net Asset Valuation by Investee
| Net Asset Valuation by Investee | FY2021 | FY2022 | FY2023 | FY2024 | FY2025 |
|---|---|---|---|---|---|
| PT Tower Bersama Infrastructure Tbk. (TBIG) | 22,879,000 | 14,318,000 | 16,448,000 | 15,936,000 | 18,663,000 |
| PT Merdeka Copper Gold Tbk. (MDKA) | 16,299,000 | 18,223,000 | 12,238,000 | 7,668,000 | 10,806,000 |
| PT Alamtri Resources Indonesia Tbk. (ADRO, formerly Adaro Energy) | 10,925,000 | 18,692,000 | 11,557,000 | 11,800,000 | 8,789,000 |
| PT Adaro Andalan Indonesia Tbk. (AADI) | — | — | — | 9,375,000 | 8,226,000 |
| PT Mitra Pinasthika Mustika Tbk. (MPMX) | 2,897,000 | 2,834,000 | 2,657,000 | 2,492,000 | 2,442,000 |
Source: company filings [17] [18] [19] [20]. Click any linked figure to open the filing page with the row highlighted.
Effective Ownership in Listed Investees
| Effective Ownership in Listed Investees | FY2021 | FY2022 | FY2023 | FY2024 | FY2025 |
|---|---|---|---|---|---|
| Tower Bersama Infrastructure (TBIG) | 34.2% | 26.7% | 31.5% | 31.6% | 31.6% |
| Merdeka Copper Gold (MDKA) | 18.3% | 18.3% | 18.8% | 19.4% | 19.4% |
| Alamtri Resources Indonesia / Adaro Energy (ADRO) | 15.2% | 15.2% | 15.2% | 15.8% | 16.5% |
| Mitra Pinasthika Mustika (MPMX) | 56.7% | 56.7% | 56.7% | 56.7% | 57.7% |
Source: company filings [17] [18] [19] [20]. Click any linked figure to open the filing page with the row highlighted.
Cash Income from the Portfolio
| Cash Income from the Portfolio | FY2021 | FY2022 | FY2023 | FY2024 | FY2025 |
|---|---|---|---|---|---|
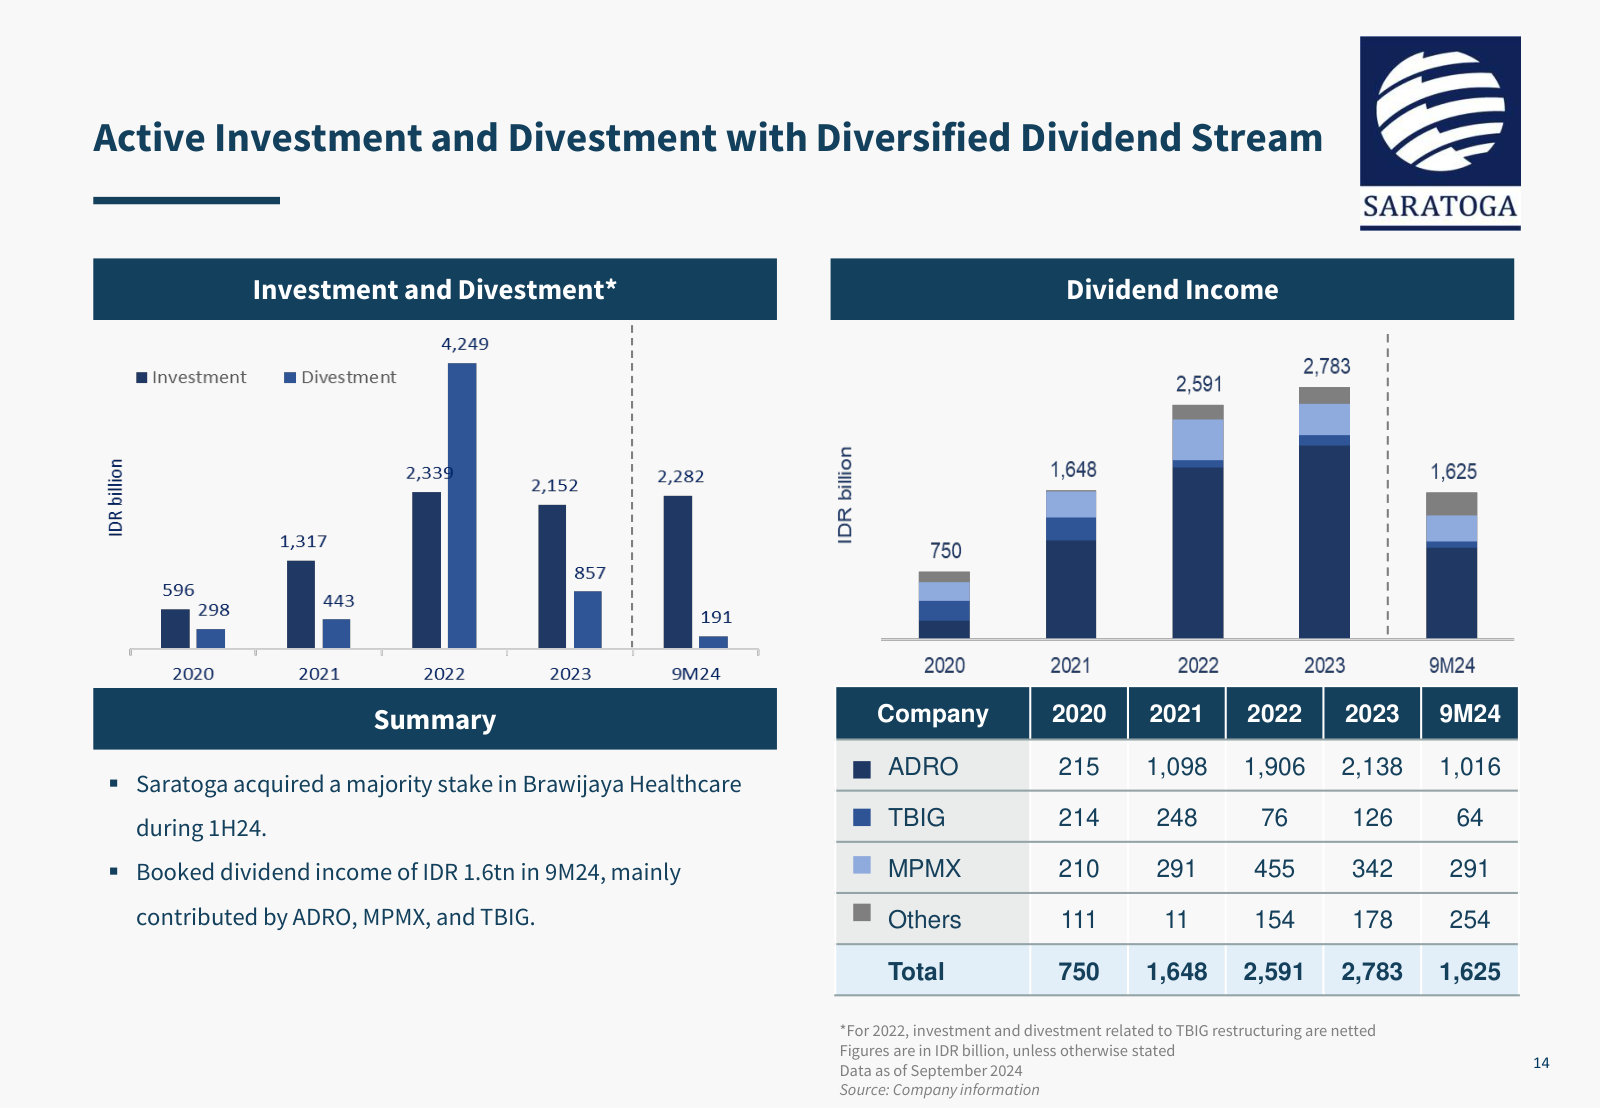
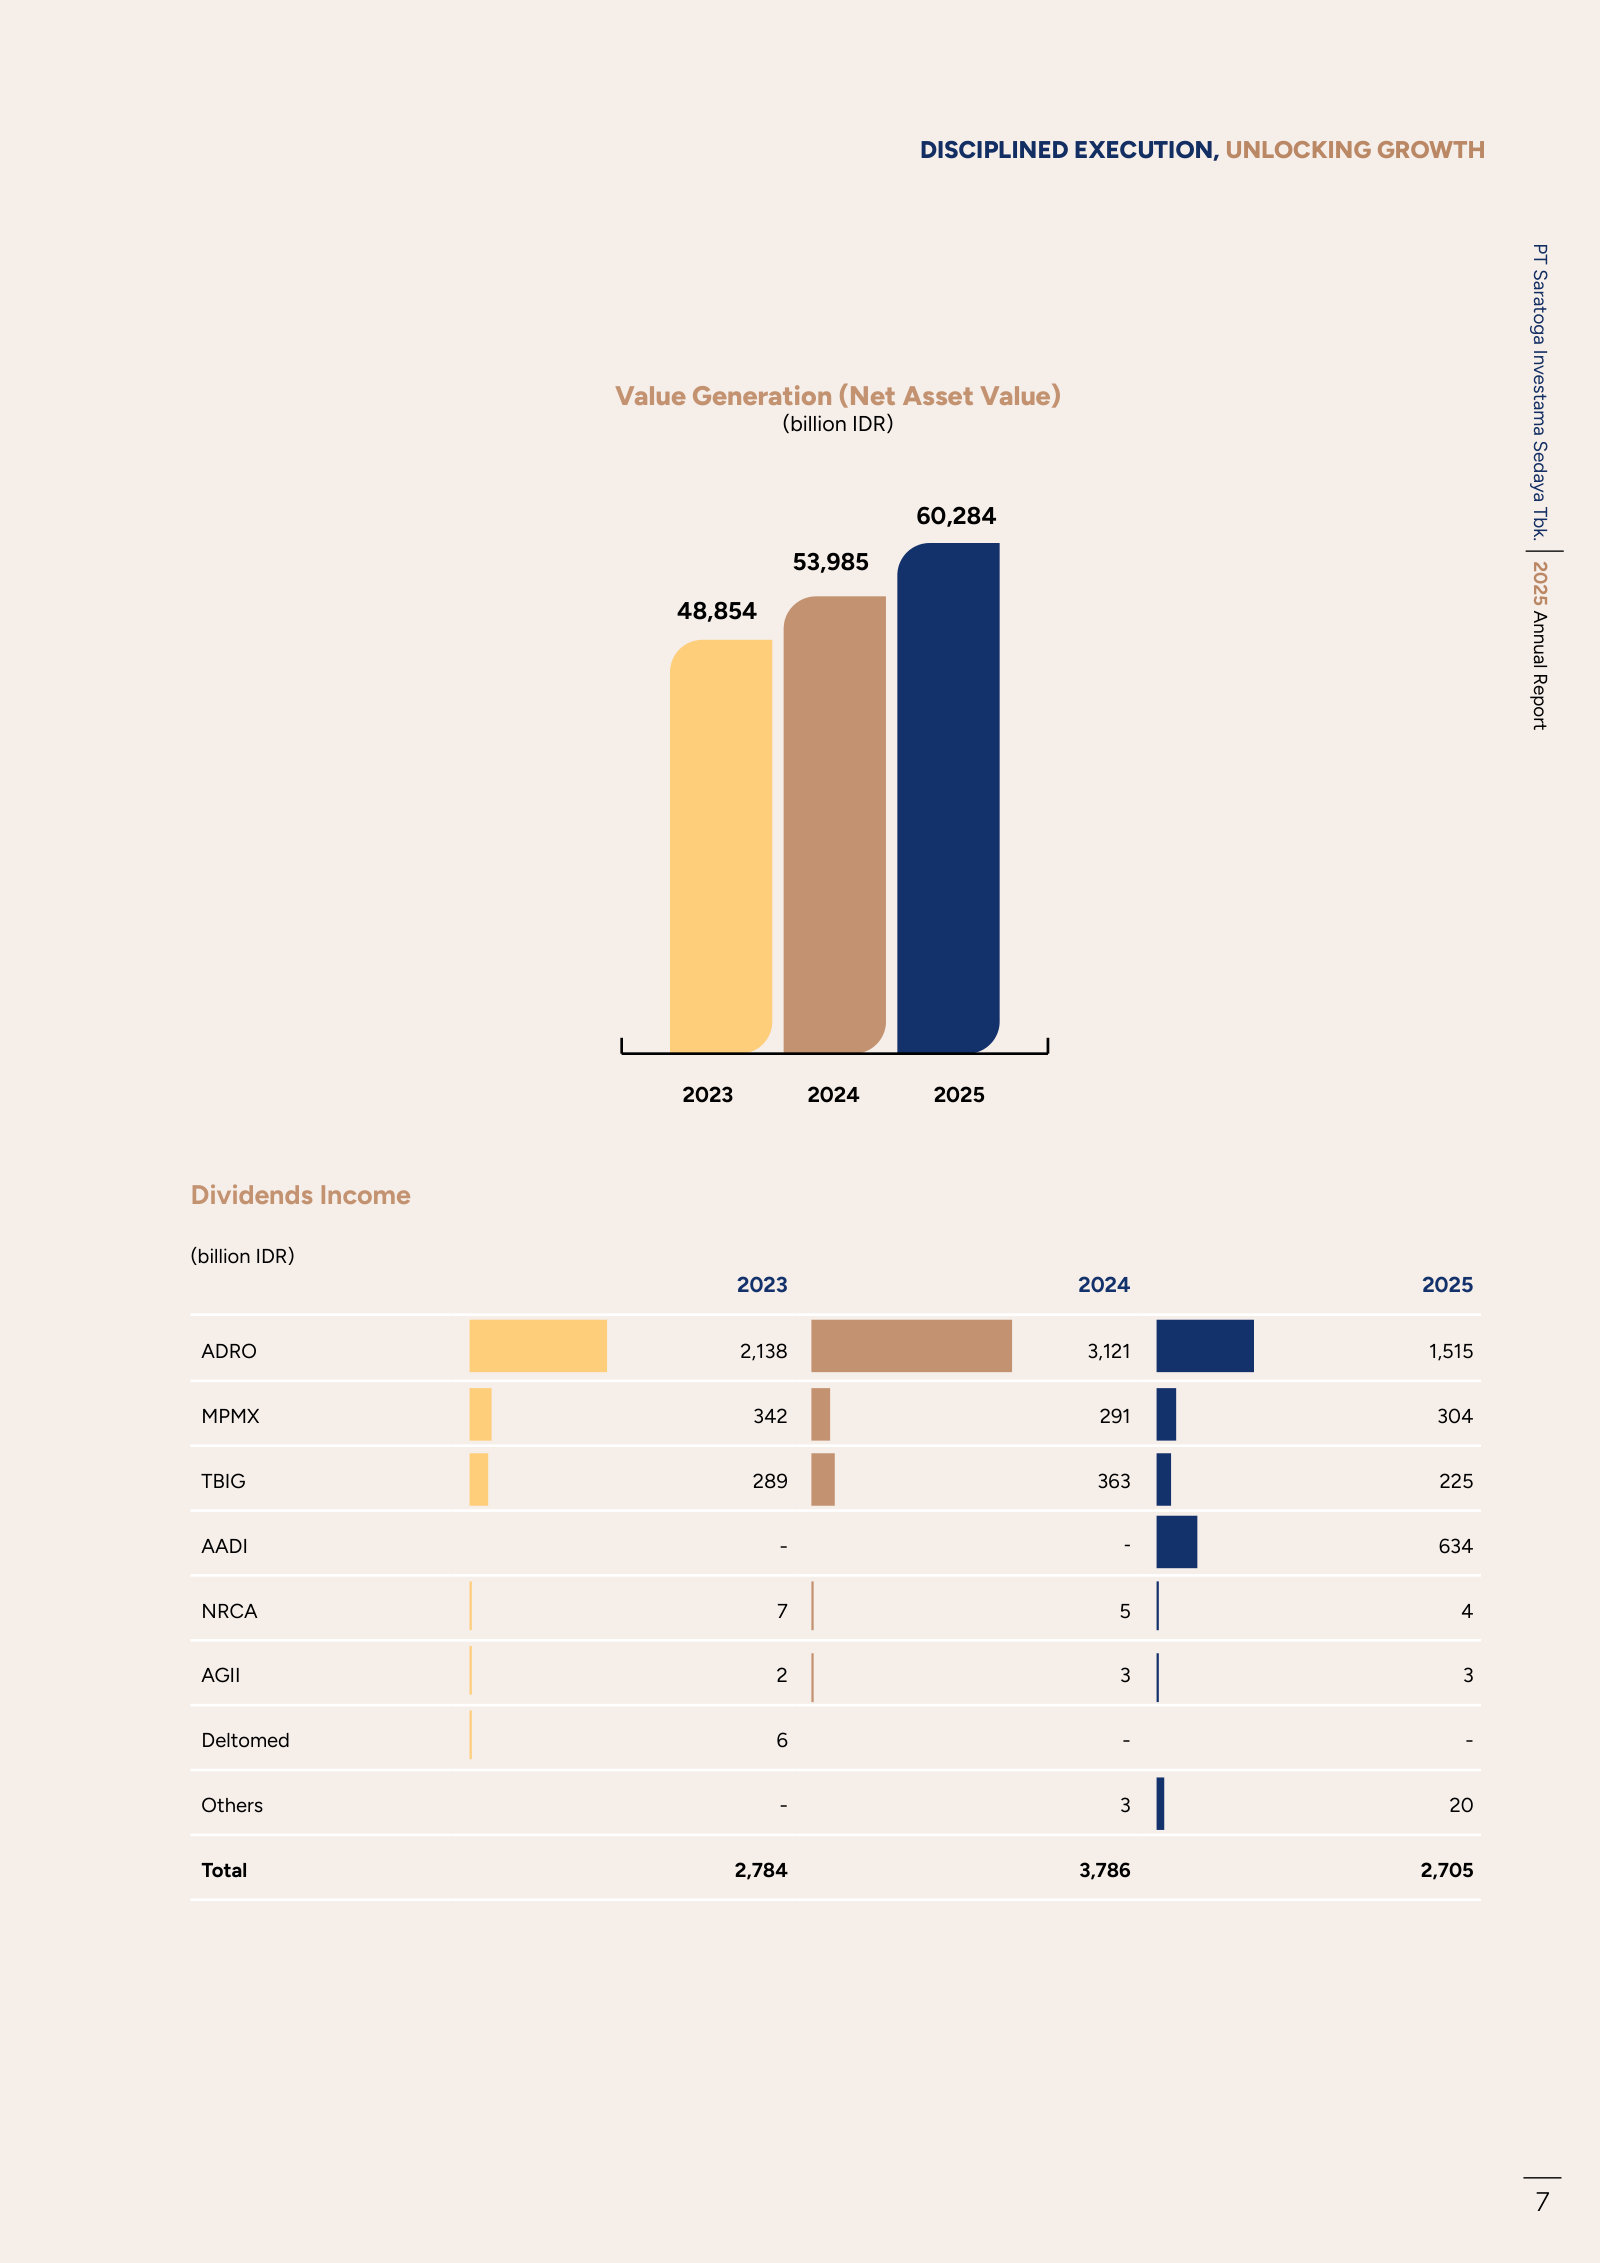
| Dividend income — Alamtri Resources / Adaro Energy (ADRO) | 1,098,000 | 1,906,000 | 2,138,000 | 3,121,000 | 1,515,000 |
| Dividend income — Adaro Andalan Indonesia (AADI) | — | — | — | — | 634,000 |
| Dividend income — Tower Bersama Infrastructure (TBIG) | 248,000 | 76,000 | 289,000 | 363,000 | 225,000 |
| Dividend income — Mitra Pinasthika Mustika (MPMX) | 291,000 | 455,000 | 342,000 | 291,000 | 304,000 |
| Total dividend income | 1,648,000 | 2,591,000 | 2,784,000 | 3,786,000 | 2,705,000 |
| Interest income | 8,000 | 18,000 | 24,000 | 63,000 | 162,000 |
Source: company filings [21] [22] [23] [24]. Click any linked figure to open the filing page with the row highlighted.
Capital Structure and Debt Service
| Capital Structure and Debt Service | FY2021 | FY2022 | FY2023 | FY2024 | FY2025 |
|---|---|---|---|---|---|
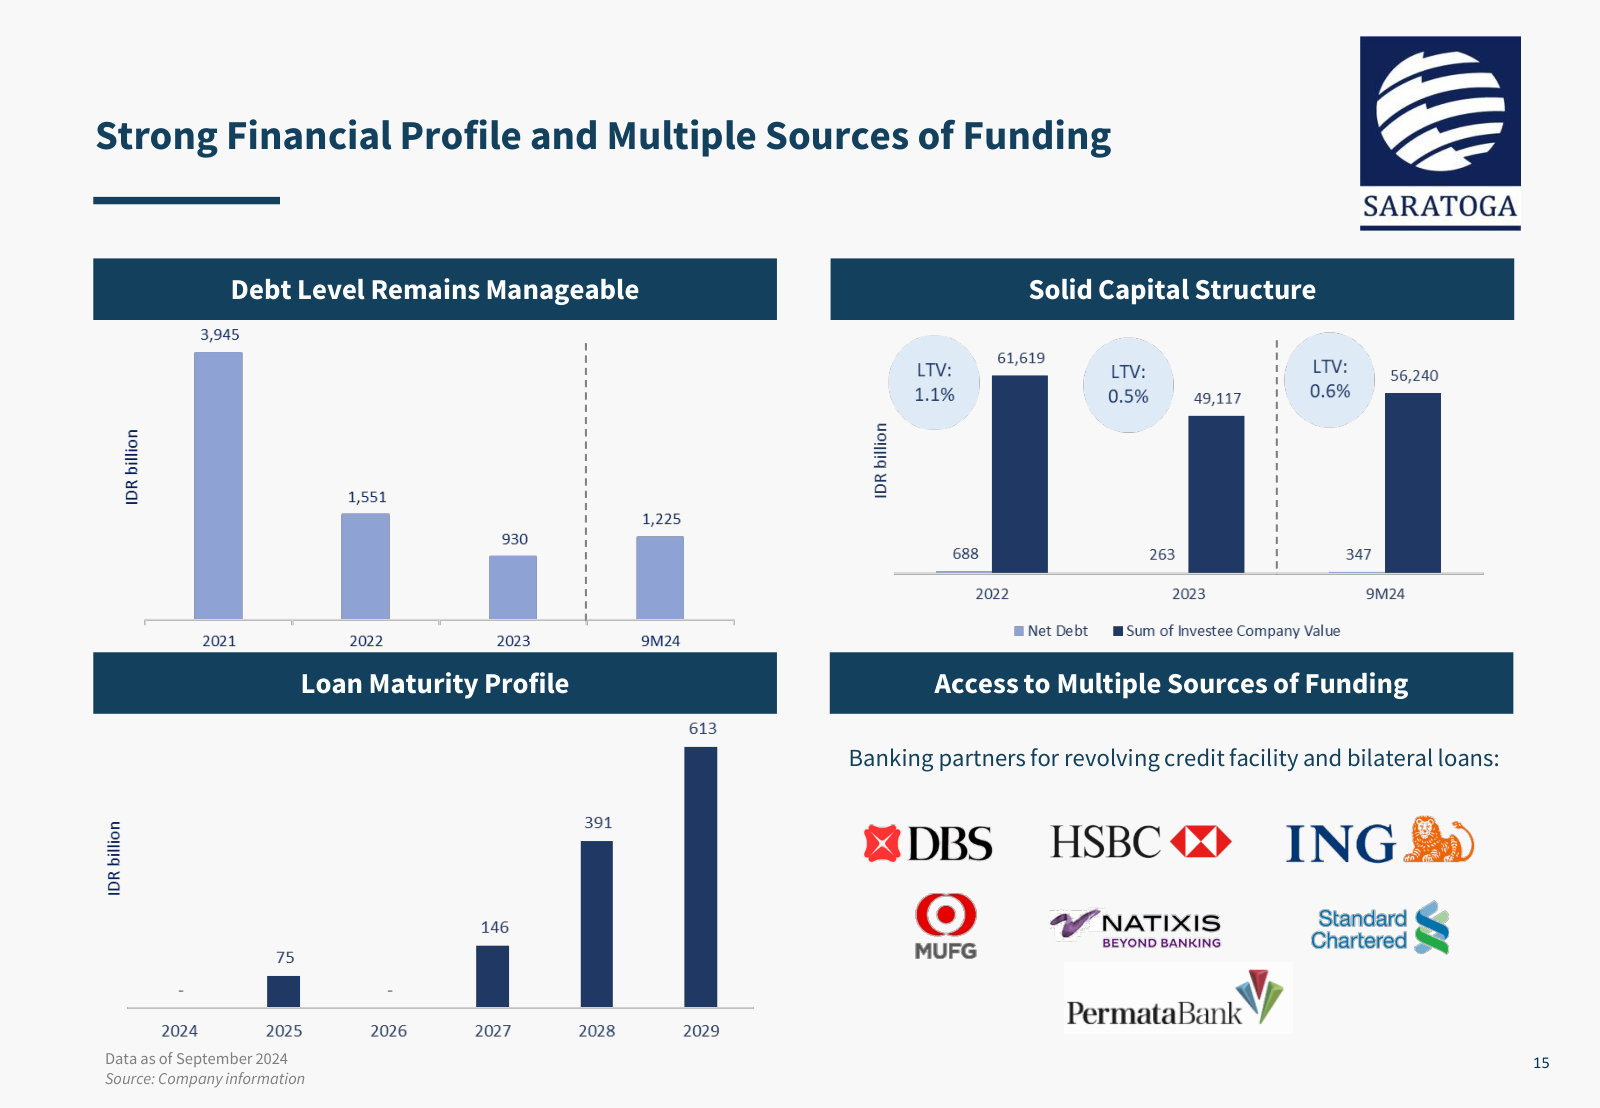
| Loan-to-value (LTV) | 6.0% | 1.0% | 0.5% | 3.0% | 0.8% |
| Net debt | 3,483,000 | 688,000 | 263,000 | 1,670,000 | 484,000 |
| Total debt / net equity | 0.1 | 0.0 | 0.0 | 0.1 | 0.0 |
| Profit for the year / average net equity | 57.0% | 8.0% | (19.0%) | 7.0% | 13.0% |
| Expense / income | 1.0% | 7.0% | (3.0%) | 7.0% | 6.0% |
Source: company filings [21] [25] [26] [27]. Click any linked figure to open the filing page with the row highlighted.
Shareholder Returns and Market Data
| Shareholder Returns and Market Data | FY2021 | FY2022 | FY2023 | FY2024 | FY2025 |
|---|---|---|---|---|---|
| Dividend per share | — | 60.00 | 75.00 | 22.00 | 14.75 |
| Closing share price (year-end, Q4) | 2,800 | 2,530 | 1,640 | 2,090 | 1,580 |
| Market capitalization (year-end) | 37,982,000 | 34,319,000 | 22,246,000 | 28,351,000 | 21,432,000 |
| Average daily trading volume, Q4 (thousand shares) | 15,919 | 14,808 | 15,430 | 25,851 | 6,035 |
| Total employees | 61 | 59 | 64 | 65 | 67 |
Source: company filings [28] [29] [30] [31]. Click any linked figure to open the filing page with the row highlighted.
Long-Term Record
| Fiscal year | Total income (loss) | Profit (loss) before tax | Profit (loss) for the year | Diluted earnings (loss) per share | Net cash from (for) operating activities | Total equity |
|---|---|---|---|---|---|---|
| FY2016 | 7,478,300 | 6,585,135 | 5,703,425 | 417 | 292,736 | 19,366,537 |
| FY2017 | 3,815,061 | 3,250,592 | 3,161,638 | 241 | 1,922,507 | 22,287,359 |
| FY2018 | (6,178,886) | (6,685,056) | (6,134,832) | (454) | (378,929) | 15,964,248 |
| FY2019 | 8,241,125 | 7,738,088 | 7,344,118 | 539 | 674,502 | 22,774,165 |
| FY2020 | 9,186,701 | 8,693,225 | 8,823,332 | 643 | 366,699 | 31,396,627 |
| FY2021 | 26,064,901 | 25,696,068 | 24,891,826 | 1,825 | (362,643) | 56,014,782 |
| FY2022 | 6,338,674 | 5,858,672 | 4,626,223 | 338 | 3,707,312 | 59,816,437 |
| FY2023 | (11,003,035) | (11,309,265) | (10,151,341) | (741) | 1,407,919 | 48,788,224 |
| FY2024 | 5,327,290 | 4,915,226 | 3,291,496 | 240 | (1,031,484) | 51,772,808 |
| FY2025 | 7,006,519 | 6,608,617 | 7,322,326 | 538 | 1,384,281 | 58,918,834 |
Source: consolidated statements across filings; older years from the standardized feed [5] [13] [1] [9]. Click any linked figure to open the filing page with the row highlighted.
Operating KPIs
| KPI | FY2021 | FY2022 | FY2023 | FY2024 | FY2025 |
|---|---|---|---|---|---|
| Net Asset Value | 56,316,000 | 60,931,000 | 48,854,000 | 53,985,000 | 60,284,000 |
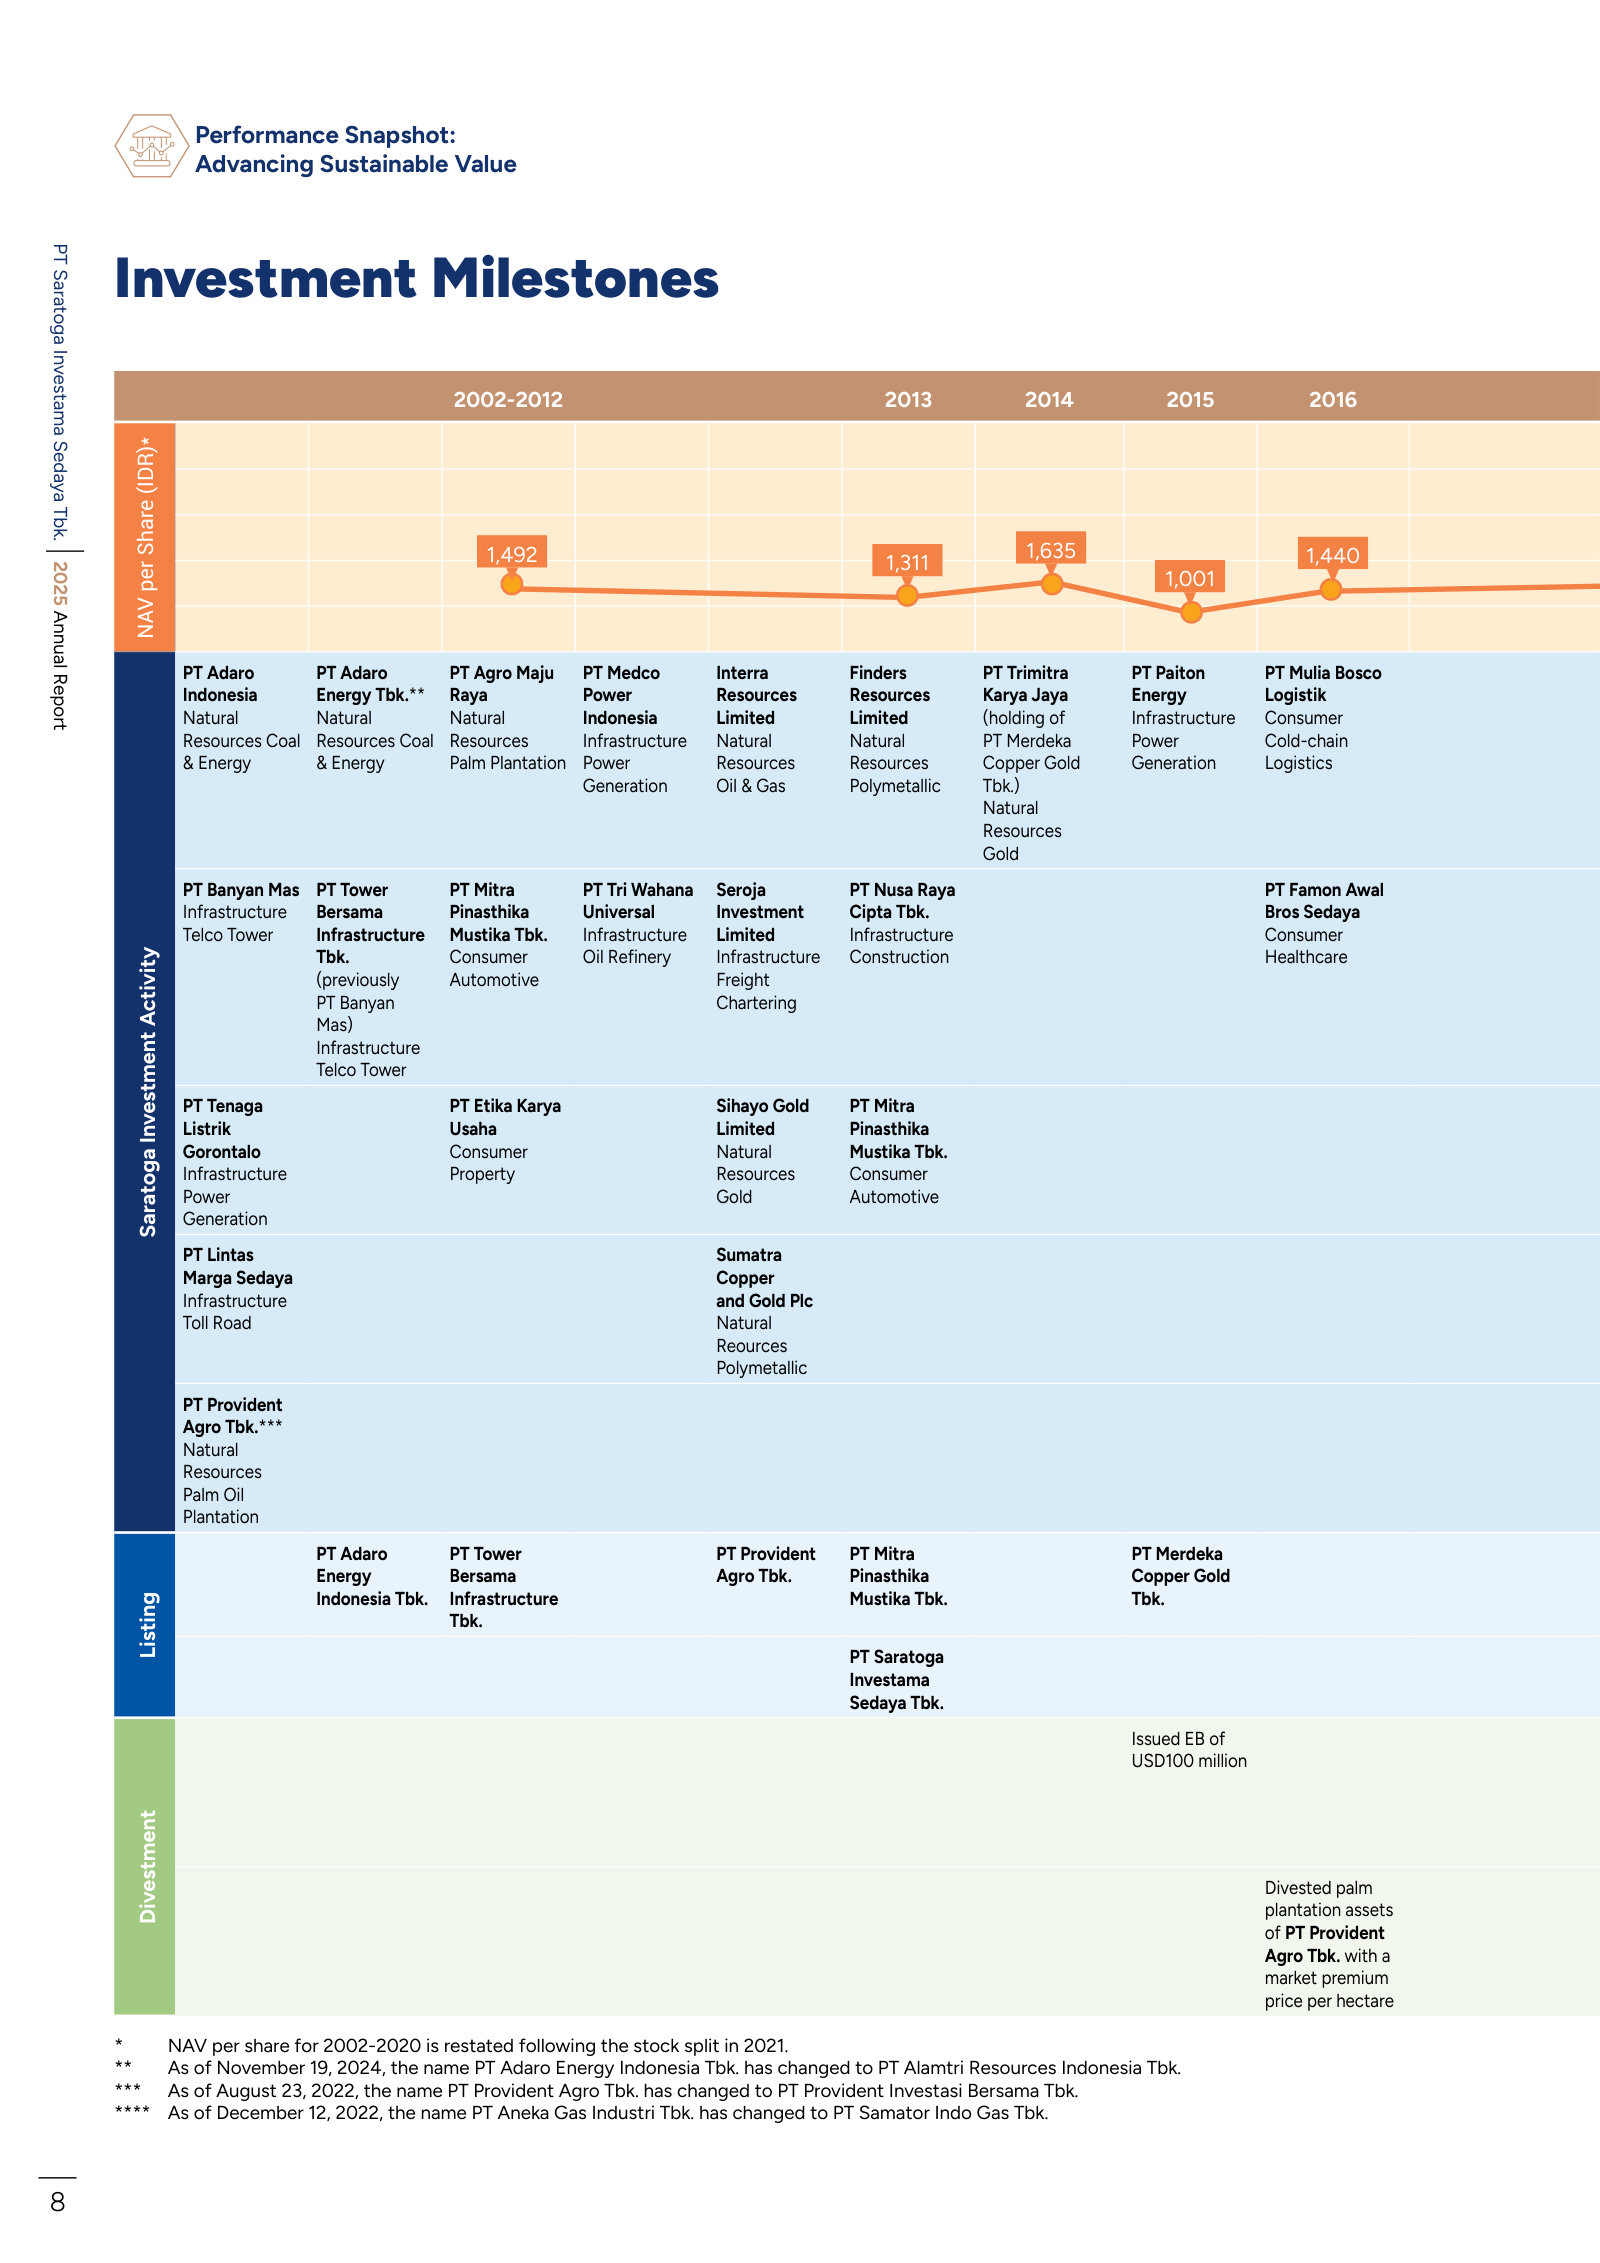
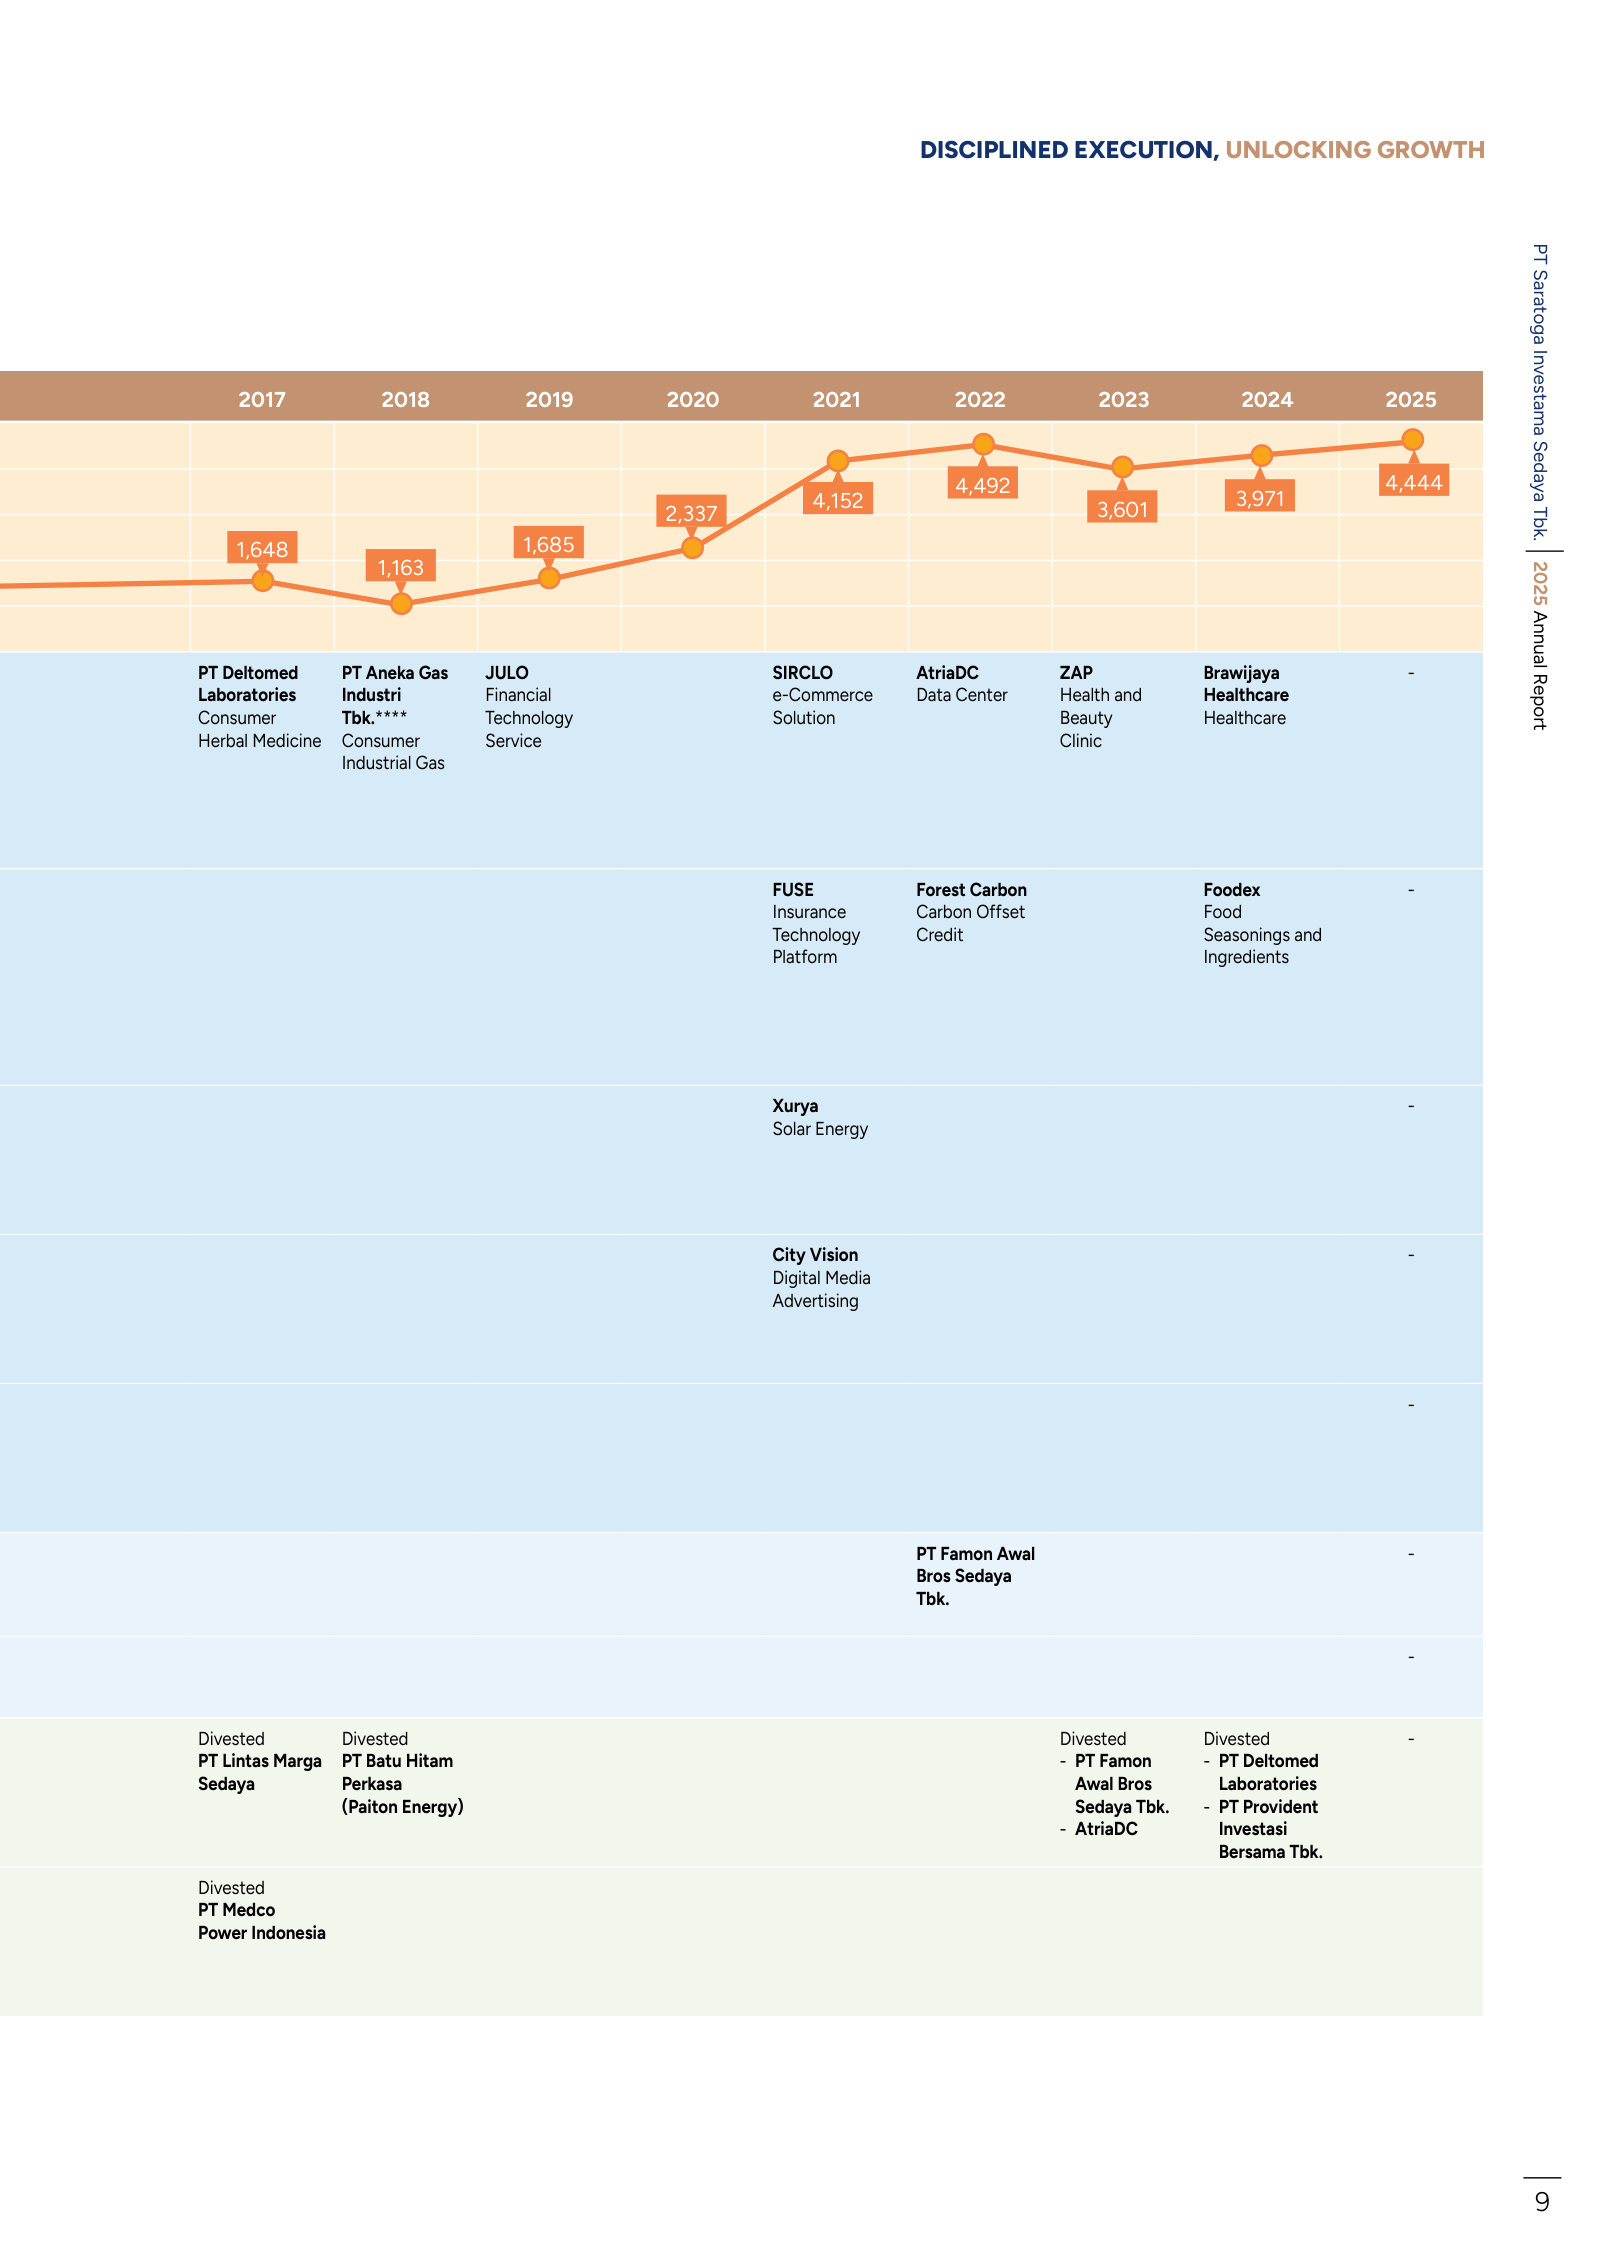
| Net Asset Value per share | 4,152 | 4,492 | 3,601 | 3,980 | 4,444 |
| Sum of investee companies (portfolio value) | 59,799,000 | 61,619,000 | 49,116,000 | 55,655,000 | 60,768,000 |
Source: company-reported operating metrics [17] [18] [19] [20]. Click any linked figure to open the filing page with the row highlighted.
Analyst Consensus
Mean target
Median target
High target
Low target
Street ratings: 1 strong buy, 1 buy. Consensus: Strong Buy.
Estimate source: S&P Capital IQ (CapIQ) consensus, as of 2026-07-28. Estimate figures are S&P Capital IQ consensus (vendor data — no filing page links). EPS and net income use the normalized (adjusted) consensus where the street reports it.
Traceability
546 of 570 figures on this page (96%) link to the filing page where they are printed — click a linked figure to open the source PDF at that page with the row highlighted. Unlinked figures come from standardized data feeds or pre-filing years.
Saratoga Investama Sedaya is an investment holding company: it has no operating revenue line. The tab's revenue breakdown is the company's own reported segment disclosure - Income (loss), defined in the note as net gain (loss) on investments in shares and other securities plus dividend and interest income - which is negative in loss years such as FY2023.
All figures are in millions of Rupiah, the unit the audited statements are printed in ('Expressed in millions of Rupiah, unless otherwise stated'). Earnings per share are in whole Rupiah as printed.
FY2021-FY2025 statement figures are each taken from that year's own annual report (audited consolidated financial statements, Exhibits A-D). FY2016-FY2020 figures in the long-term record come from the standardized data feed and carry no page links, except FY2020, which is cited to the comparative column of the FY2021 annual report.
Segment definitions changed in the FY2021 filing: the pre-2021 scheme (Infrastructure / Natural resources / Consumer products / Head office and others) was replaced wholesale by Blue Chip / Digital technology / Growth focused / Others. The FY2021 annual report prints a bridge restating FY2020 onto the new scheme, so FY2020 is comparable; FY2016-FY2019 long-term totals are sums of the old-scheme segments and are shown without page links.
Income-statement labels follow the FY2025 annual report. Earlier filings word some lines differently - FY2022 and FY2023 print 'Dividend, interest and investment income' where FY2024-FY2025 print 'Dividend and interest income', and FY2021-FY2022 print 'other equity securities' where later years print 'other securities'. The amounts are on the same basis.
Saratoga presents an unclassified balance sheet: no current / non-current subtotals and no split of borrowings between current and long-term in any year.
The Net Asset Value KPIs are taken from the Management Discussion and Analysis value-generation table, which is printed in IDR billion. Their values are restated into the tab's IDR-millions scale (FY2025 NAV of 60,284 billion is shown as 60,284,000); the citation anchor is the figure as printed on the page.
Quarterly profit-or-loss and cash-flow statements are printed year-to-date only (three, six and nine months). Quarters after Q1 are derived as the exact difference of two printed year-to-date figures and are marked as such; balance-sheet quarters are point-in-time and are as printed. No quarterly numeric feed exists in this run, so the derived quarters could not be cross-checked against a provider series.
5 figure(s) differed between the data feed and the filing; the filing value is shown (see the run's metrics/metrics_tab.json for the audit trail).
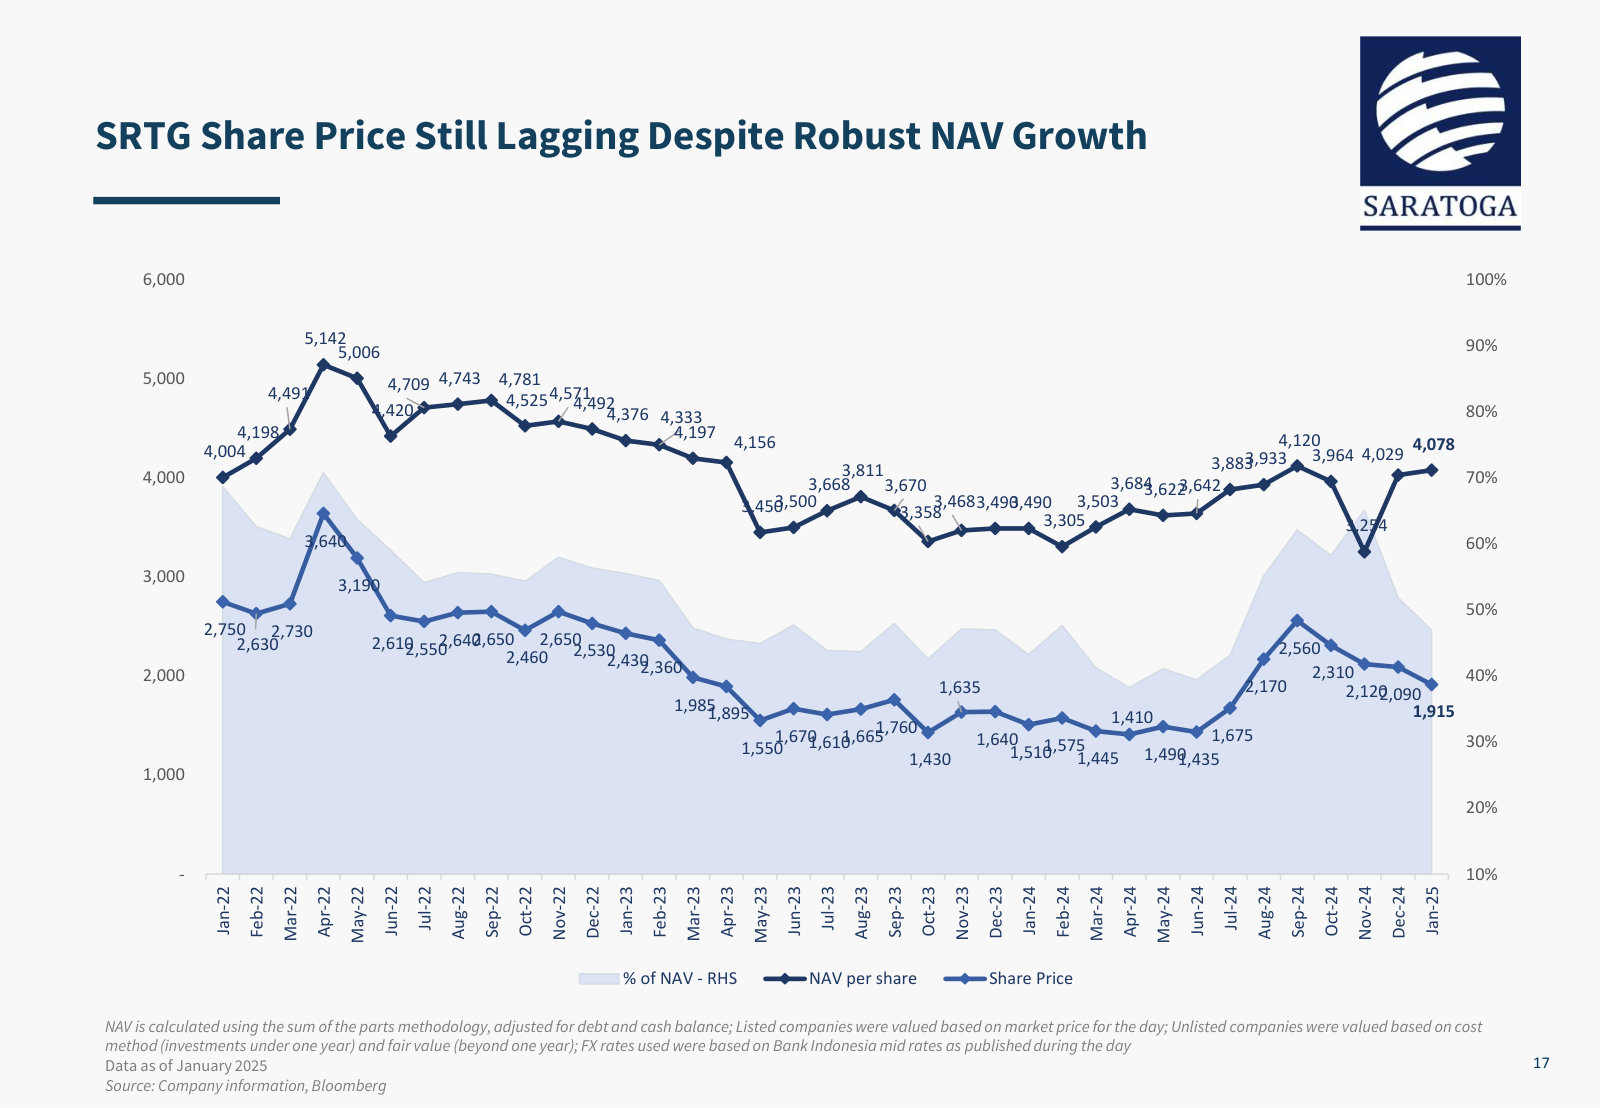
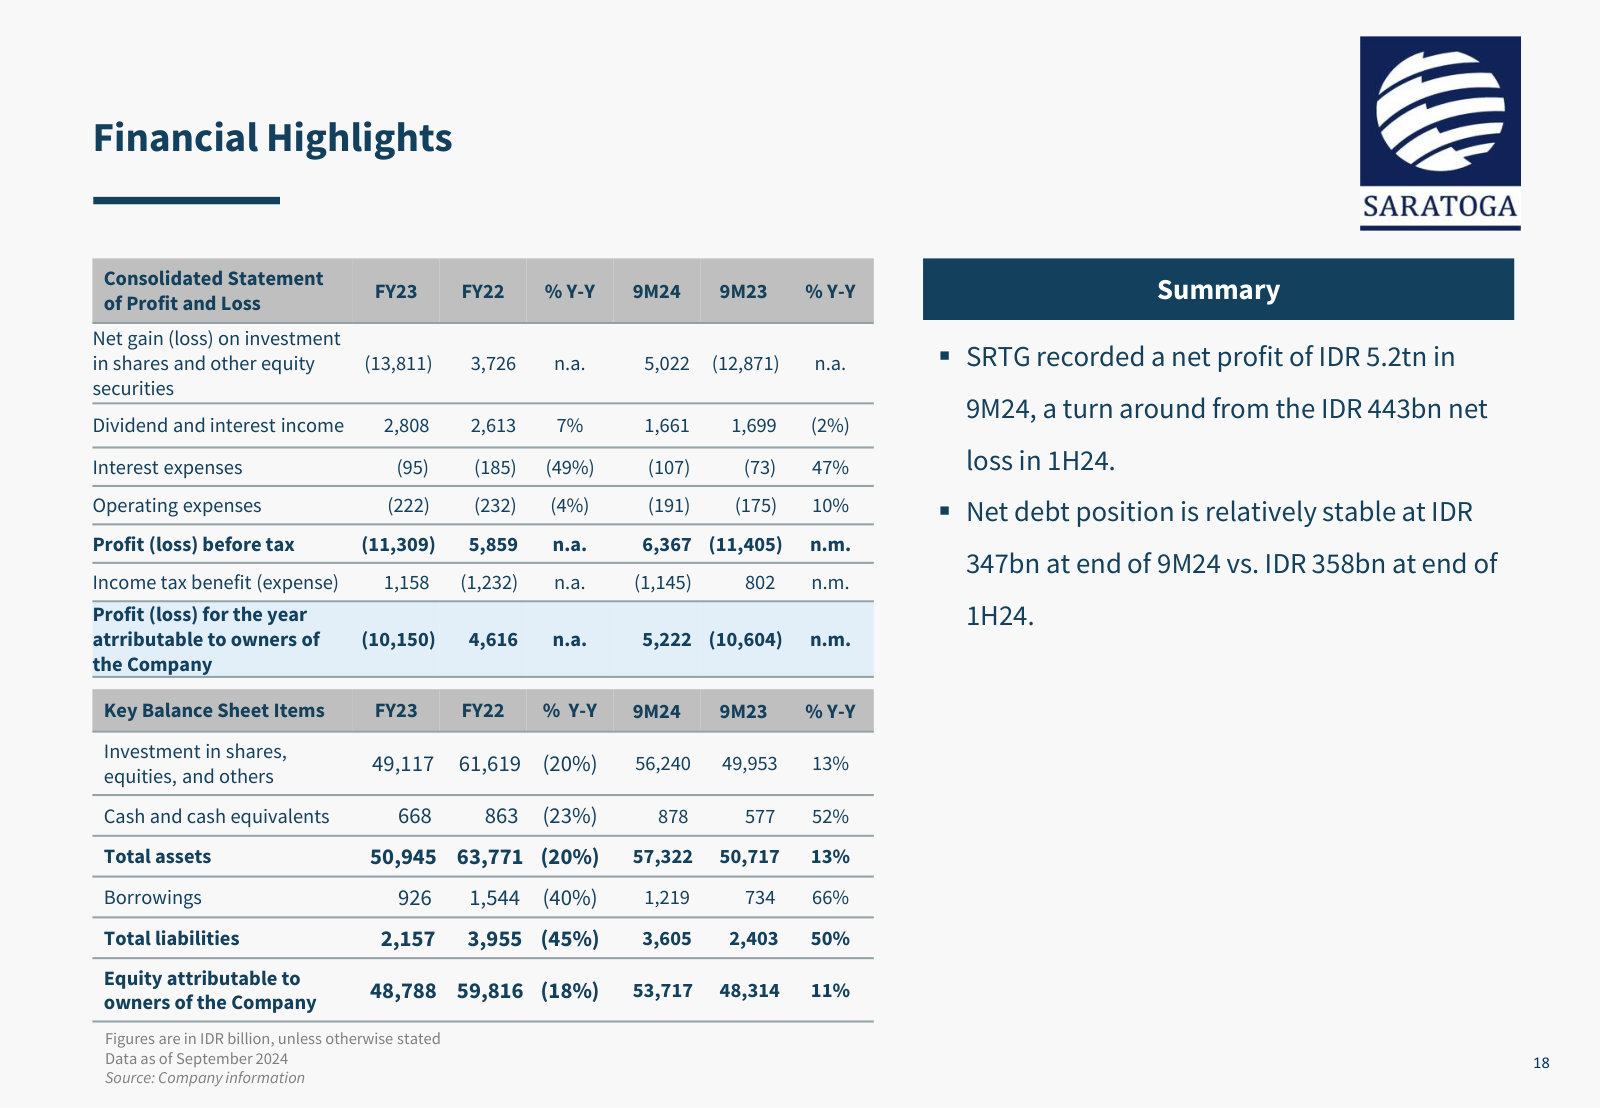
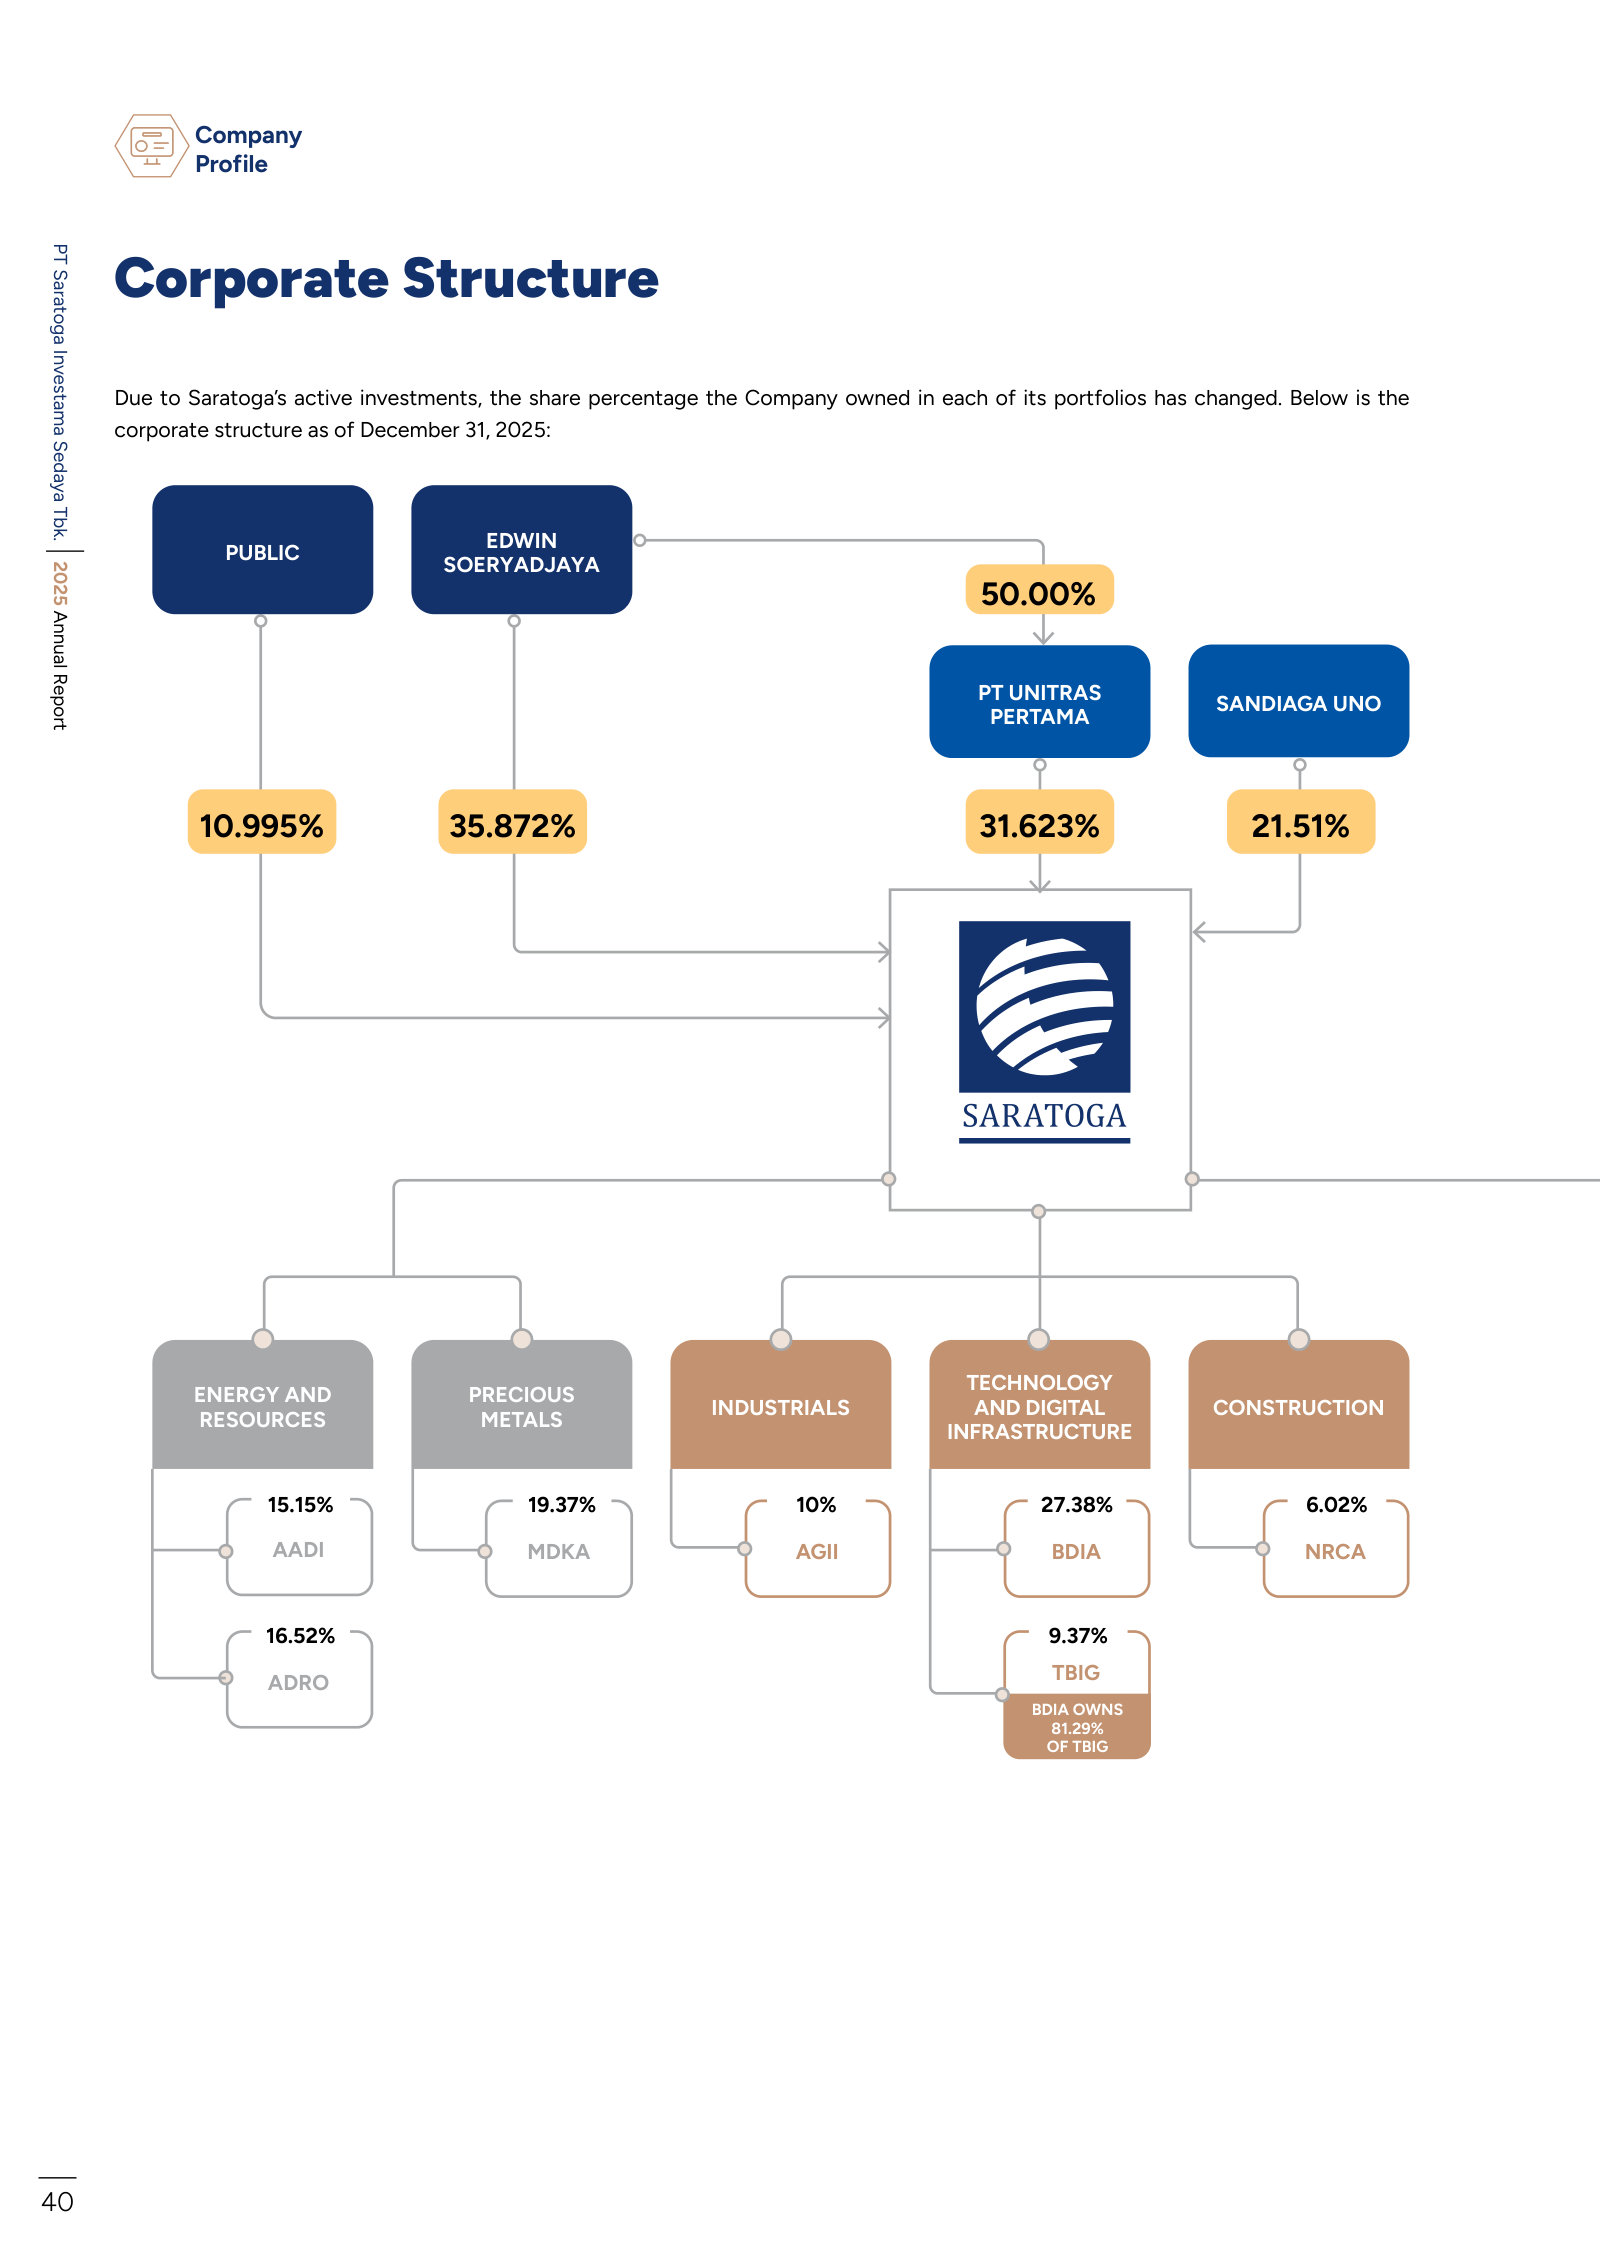
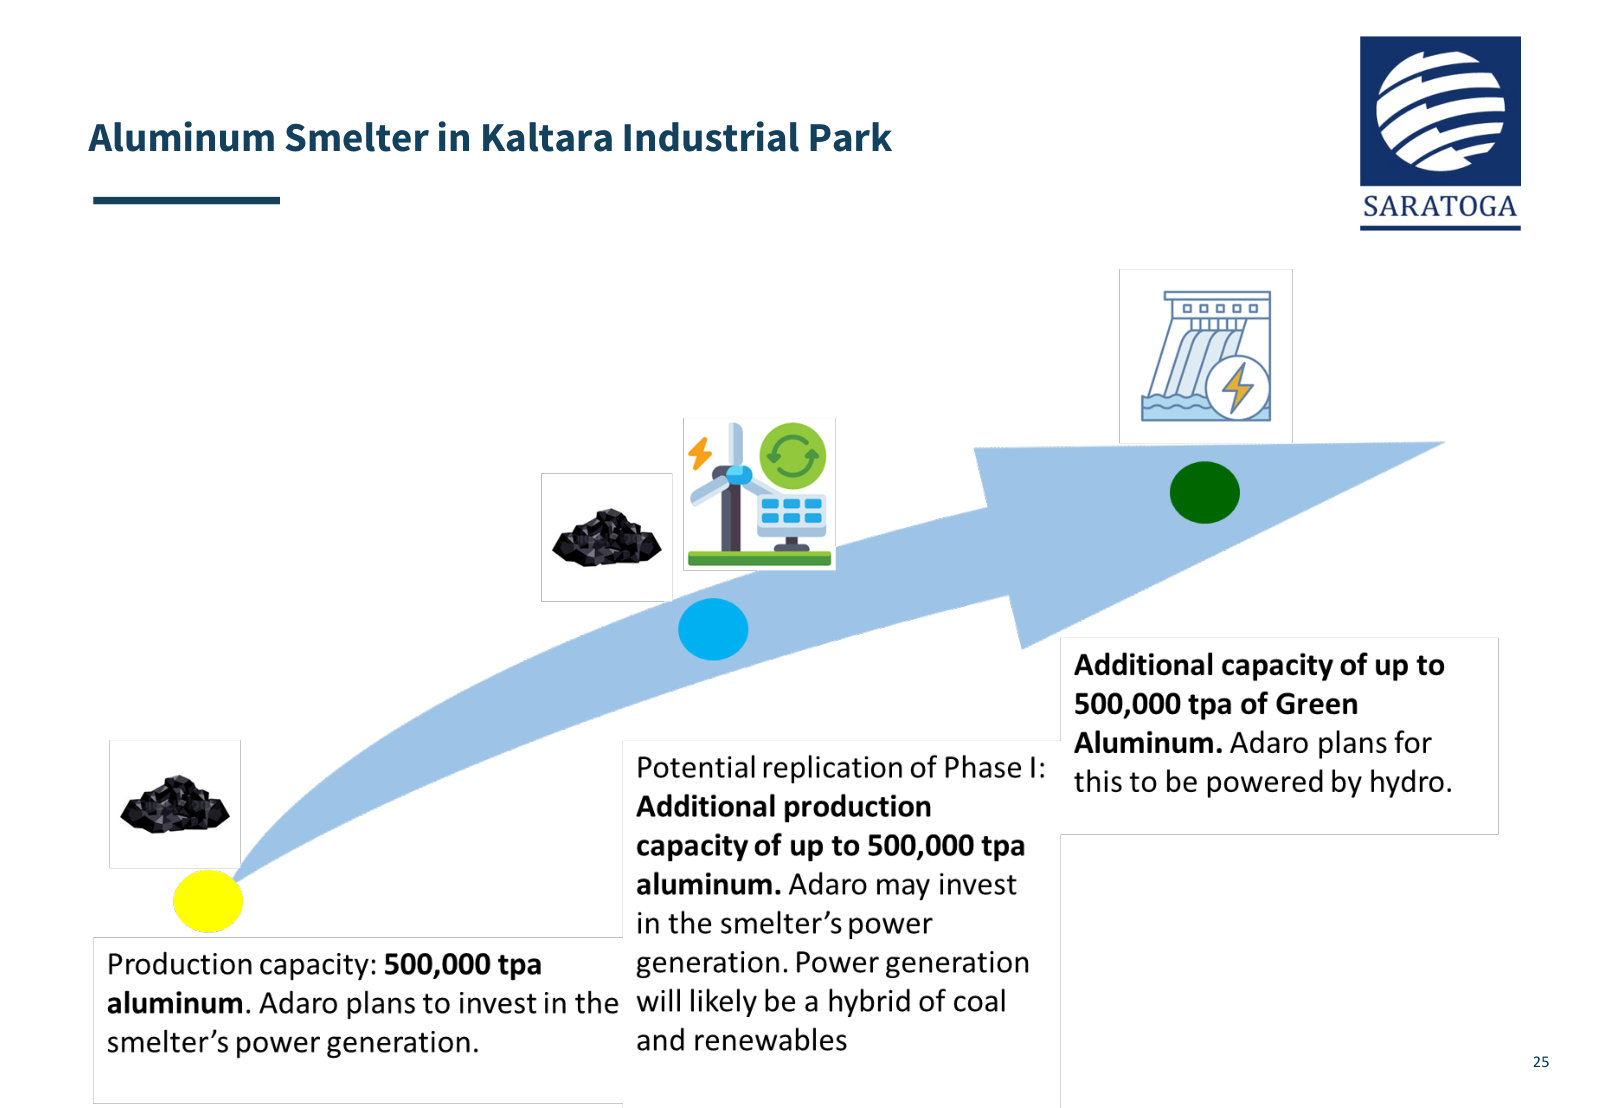
PT Saratoga Investama Sedaya Tbk's management explains the business in its own materials. The slides below do the most of that work, pulled from the documents preserved in Sources. Each source link opens the complete presentation at that slide in a new tab.
Investor Presentation — January 2025 — January 2025
Saratoga's own company-overview deck and the fastest route from zero to understanding: what it owns, how it deploys and recycles capital, and how NAV is built. · Open the full document →
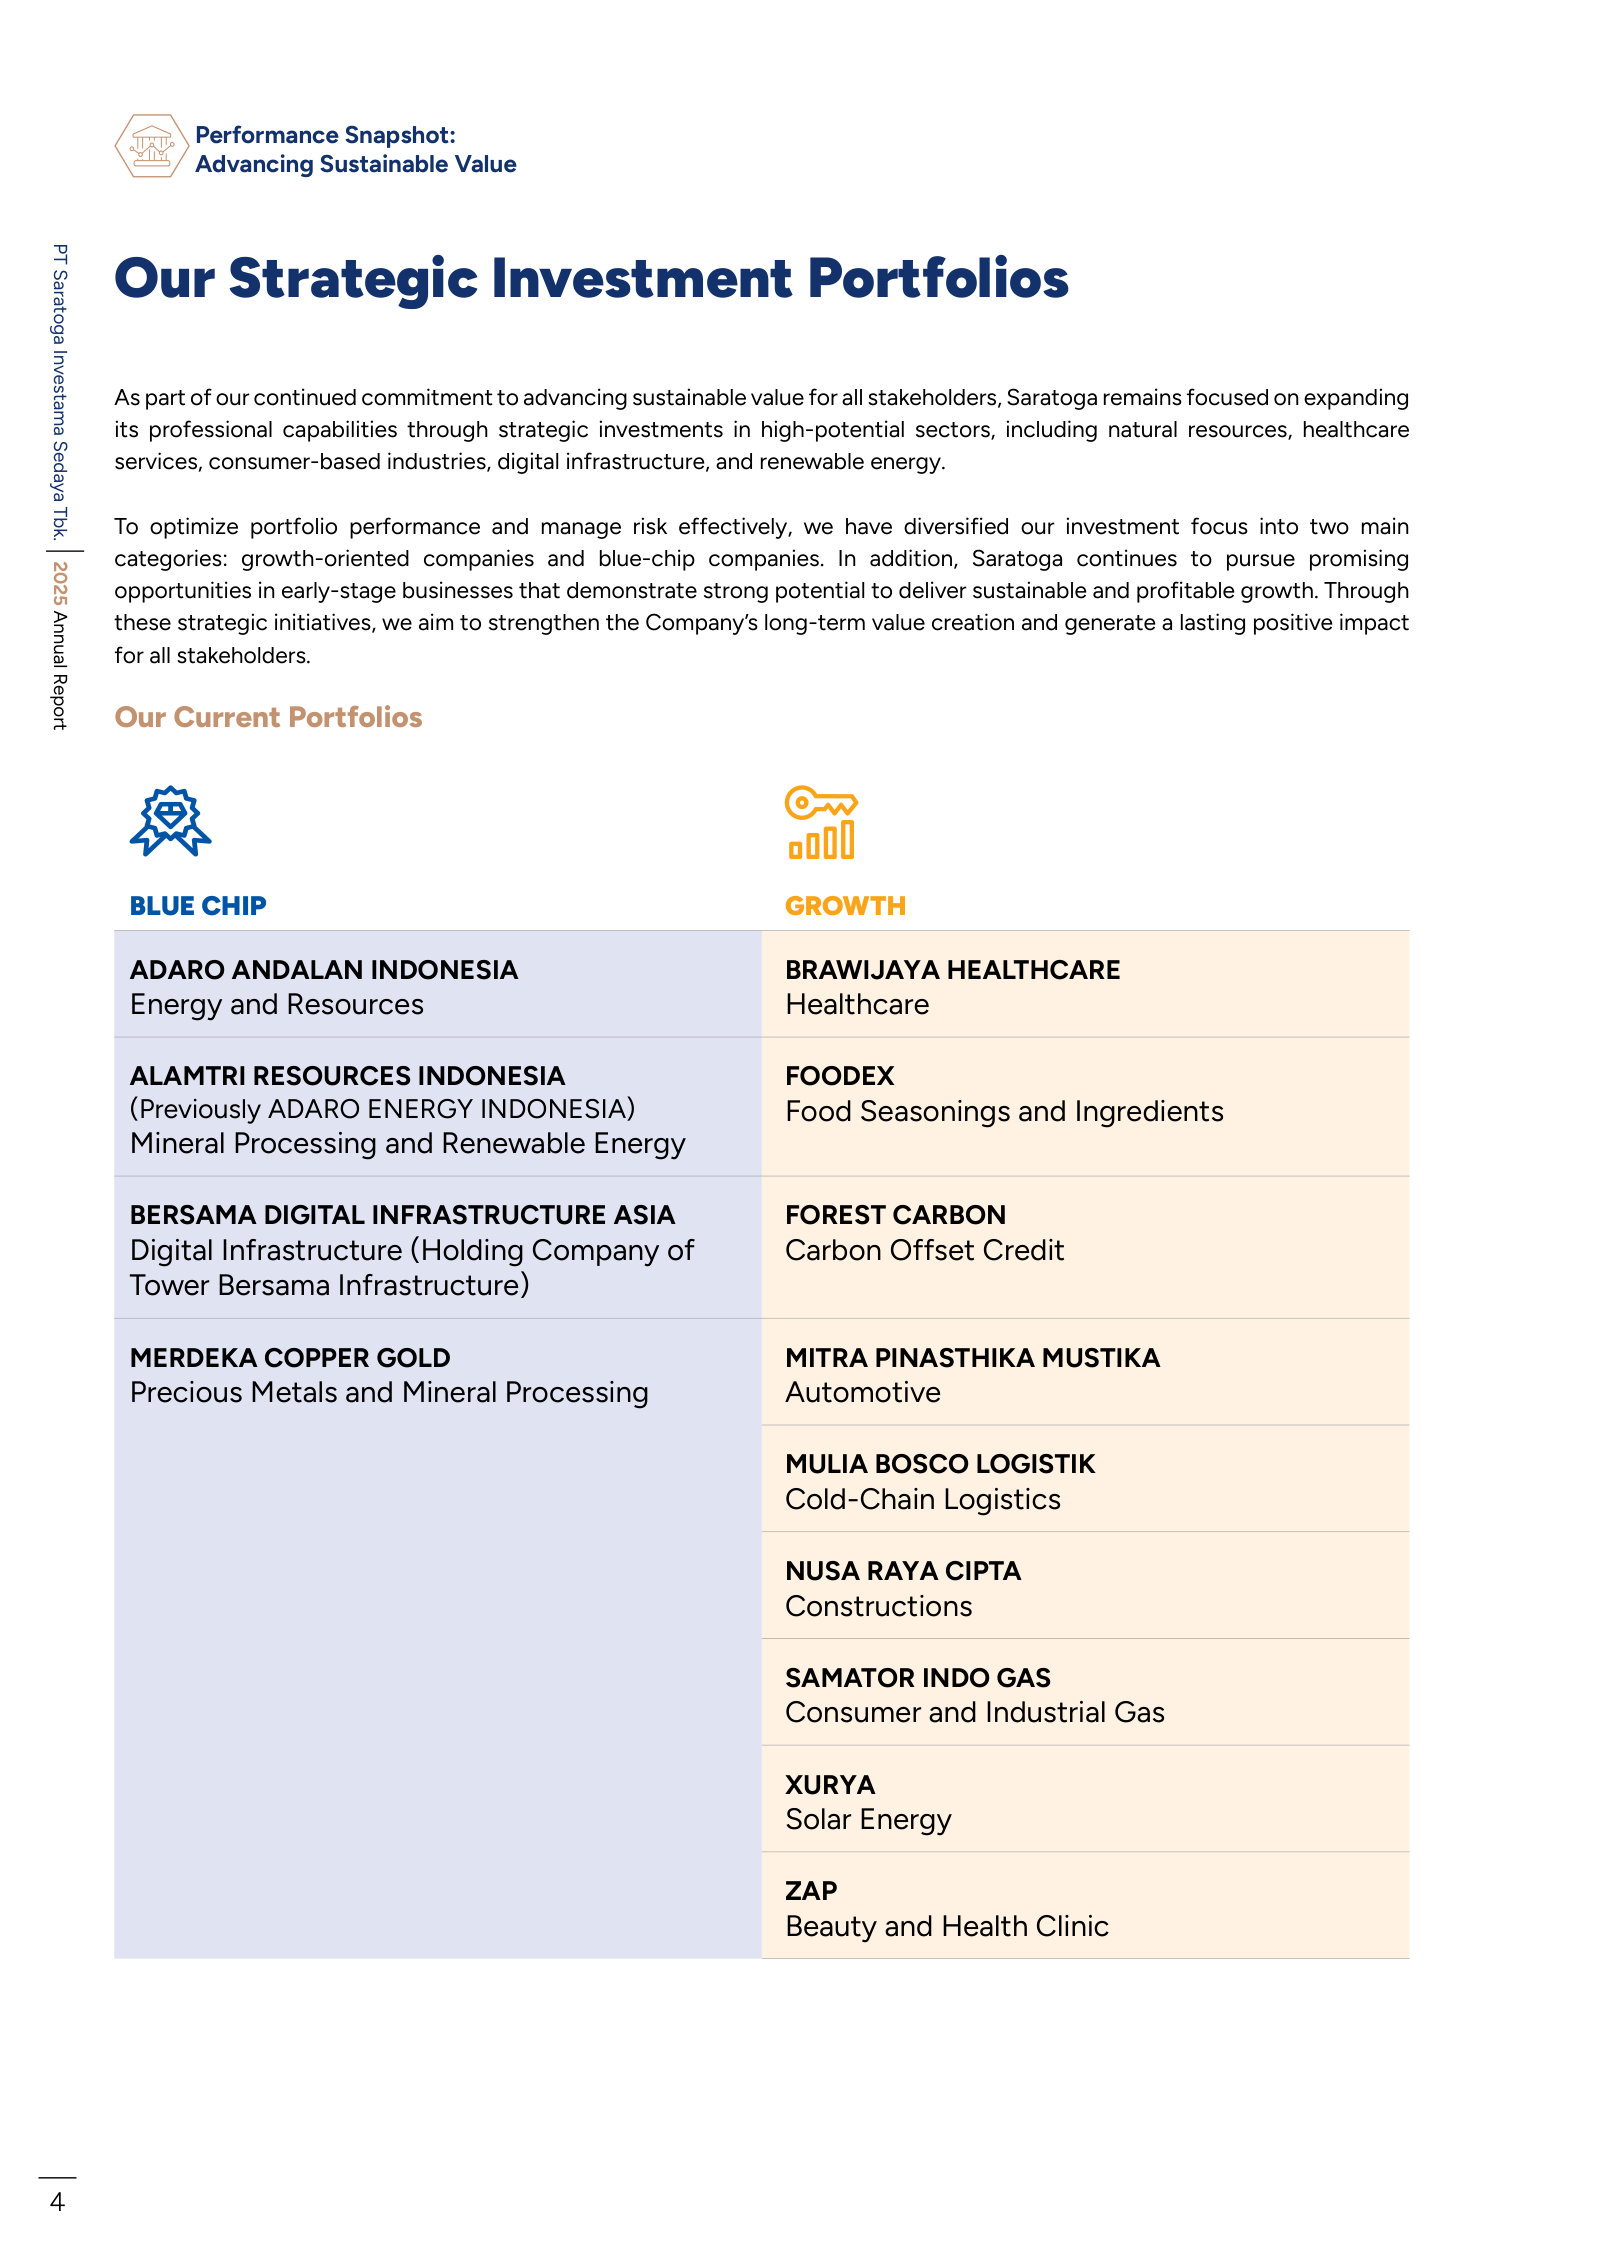
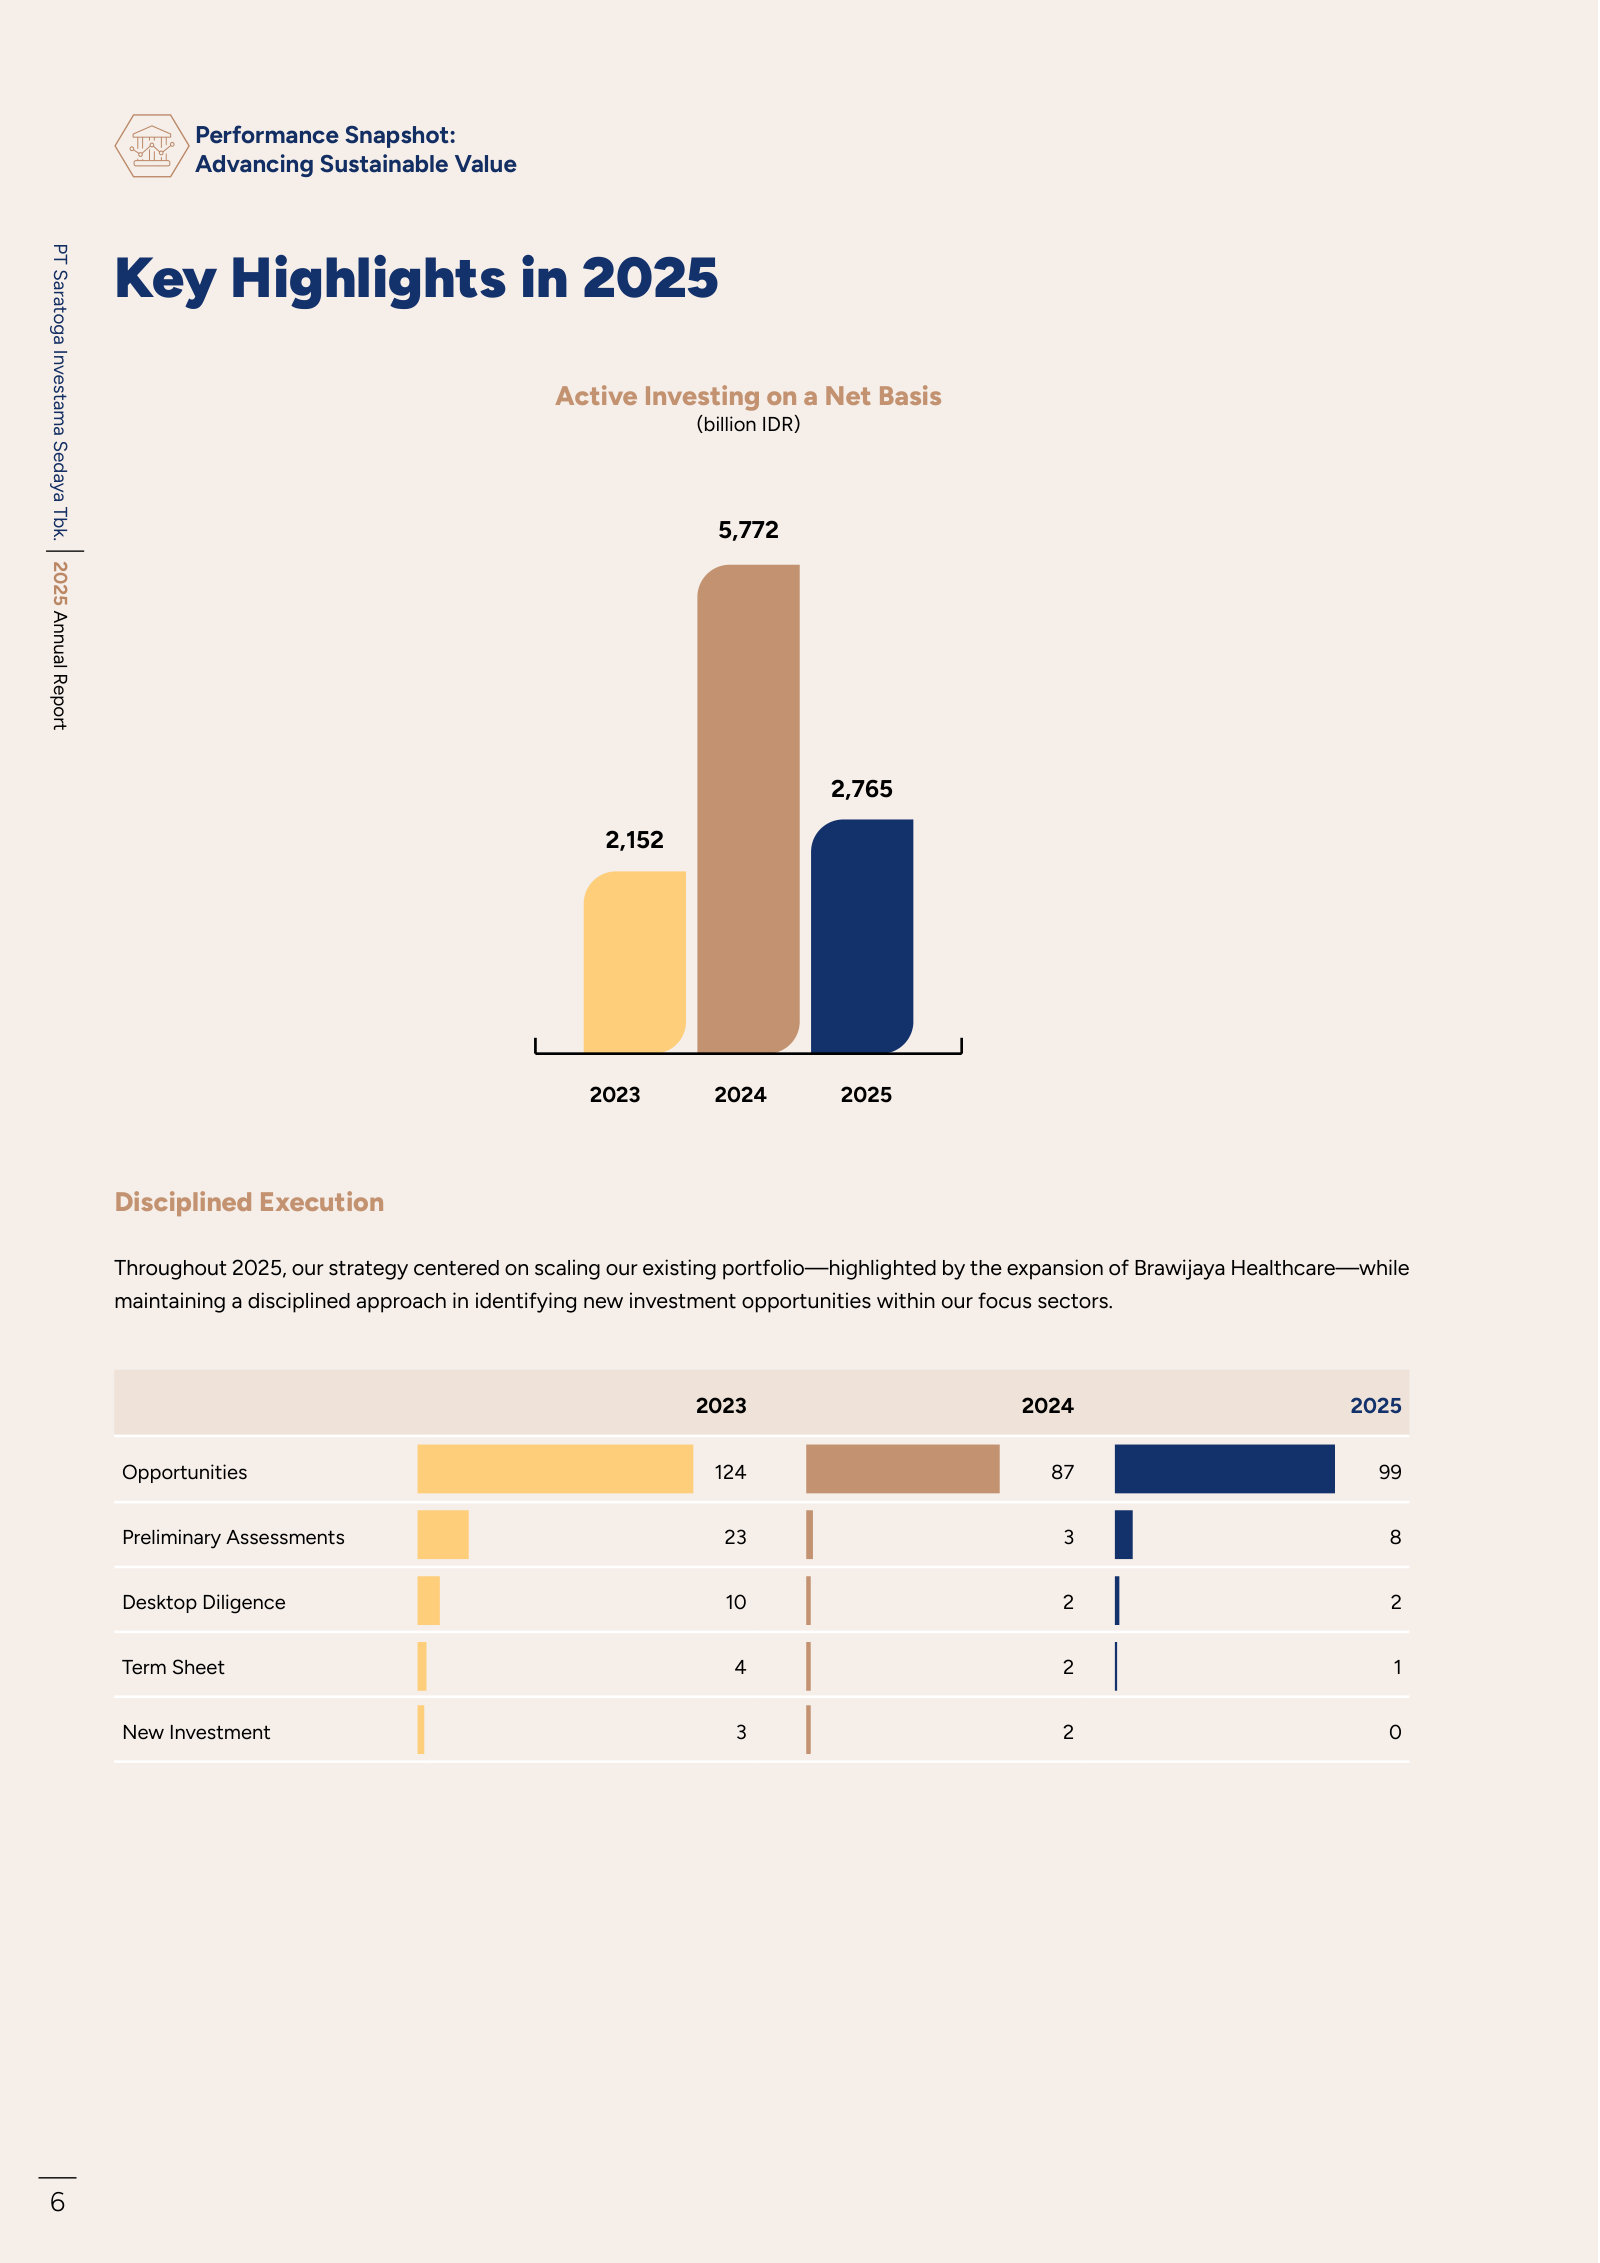
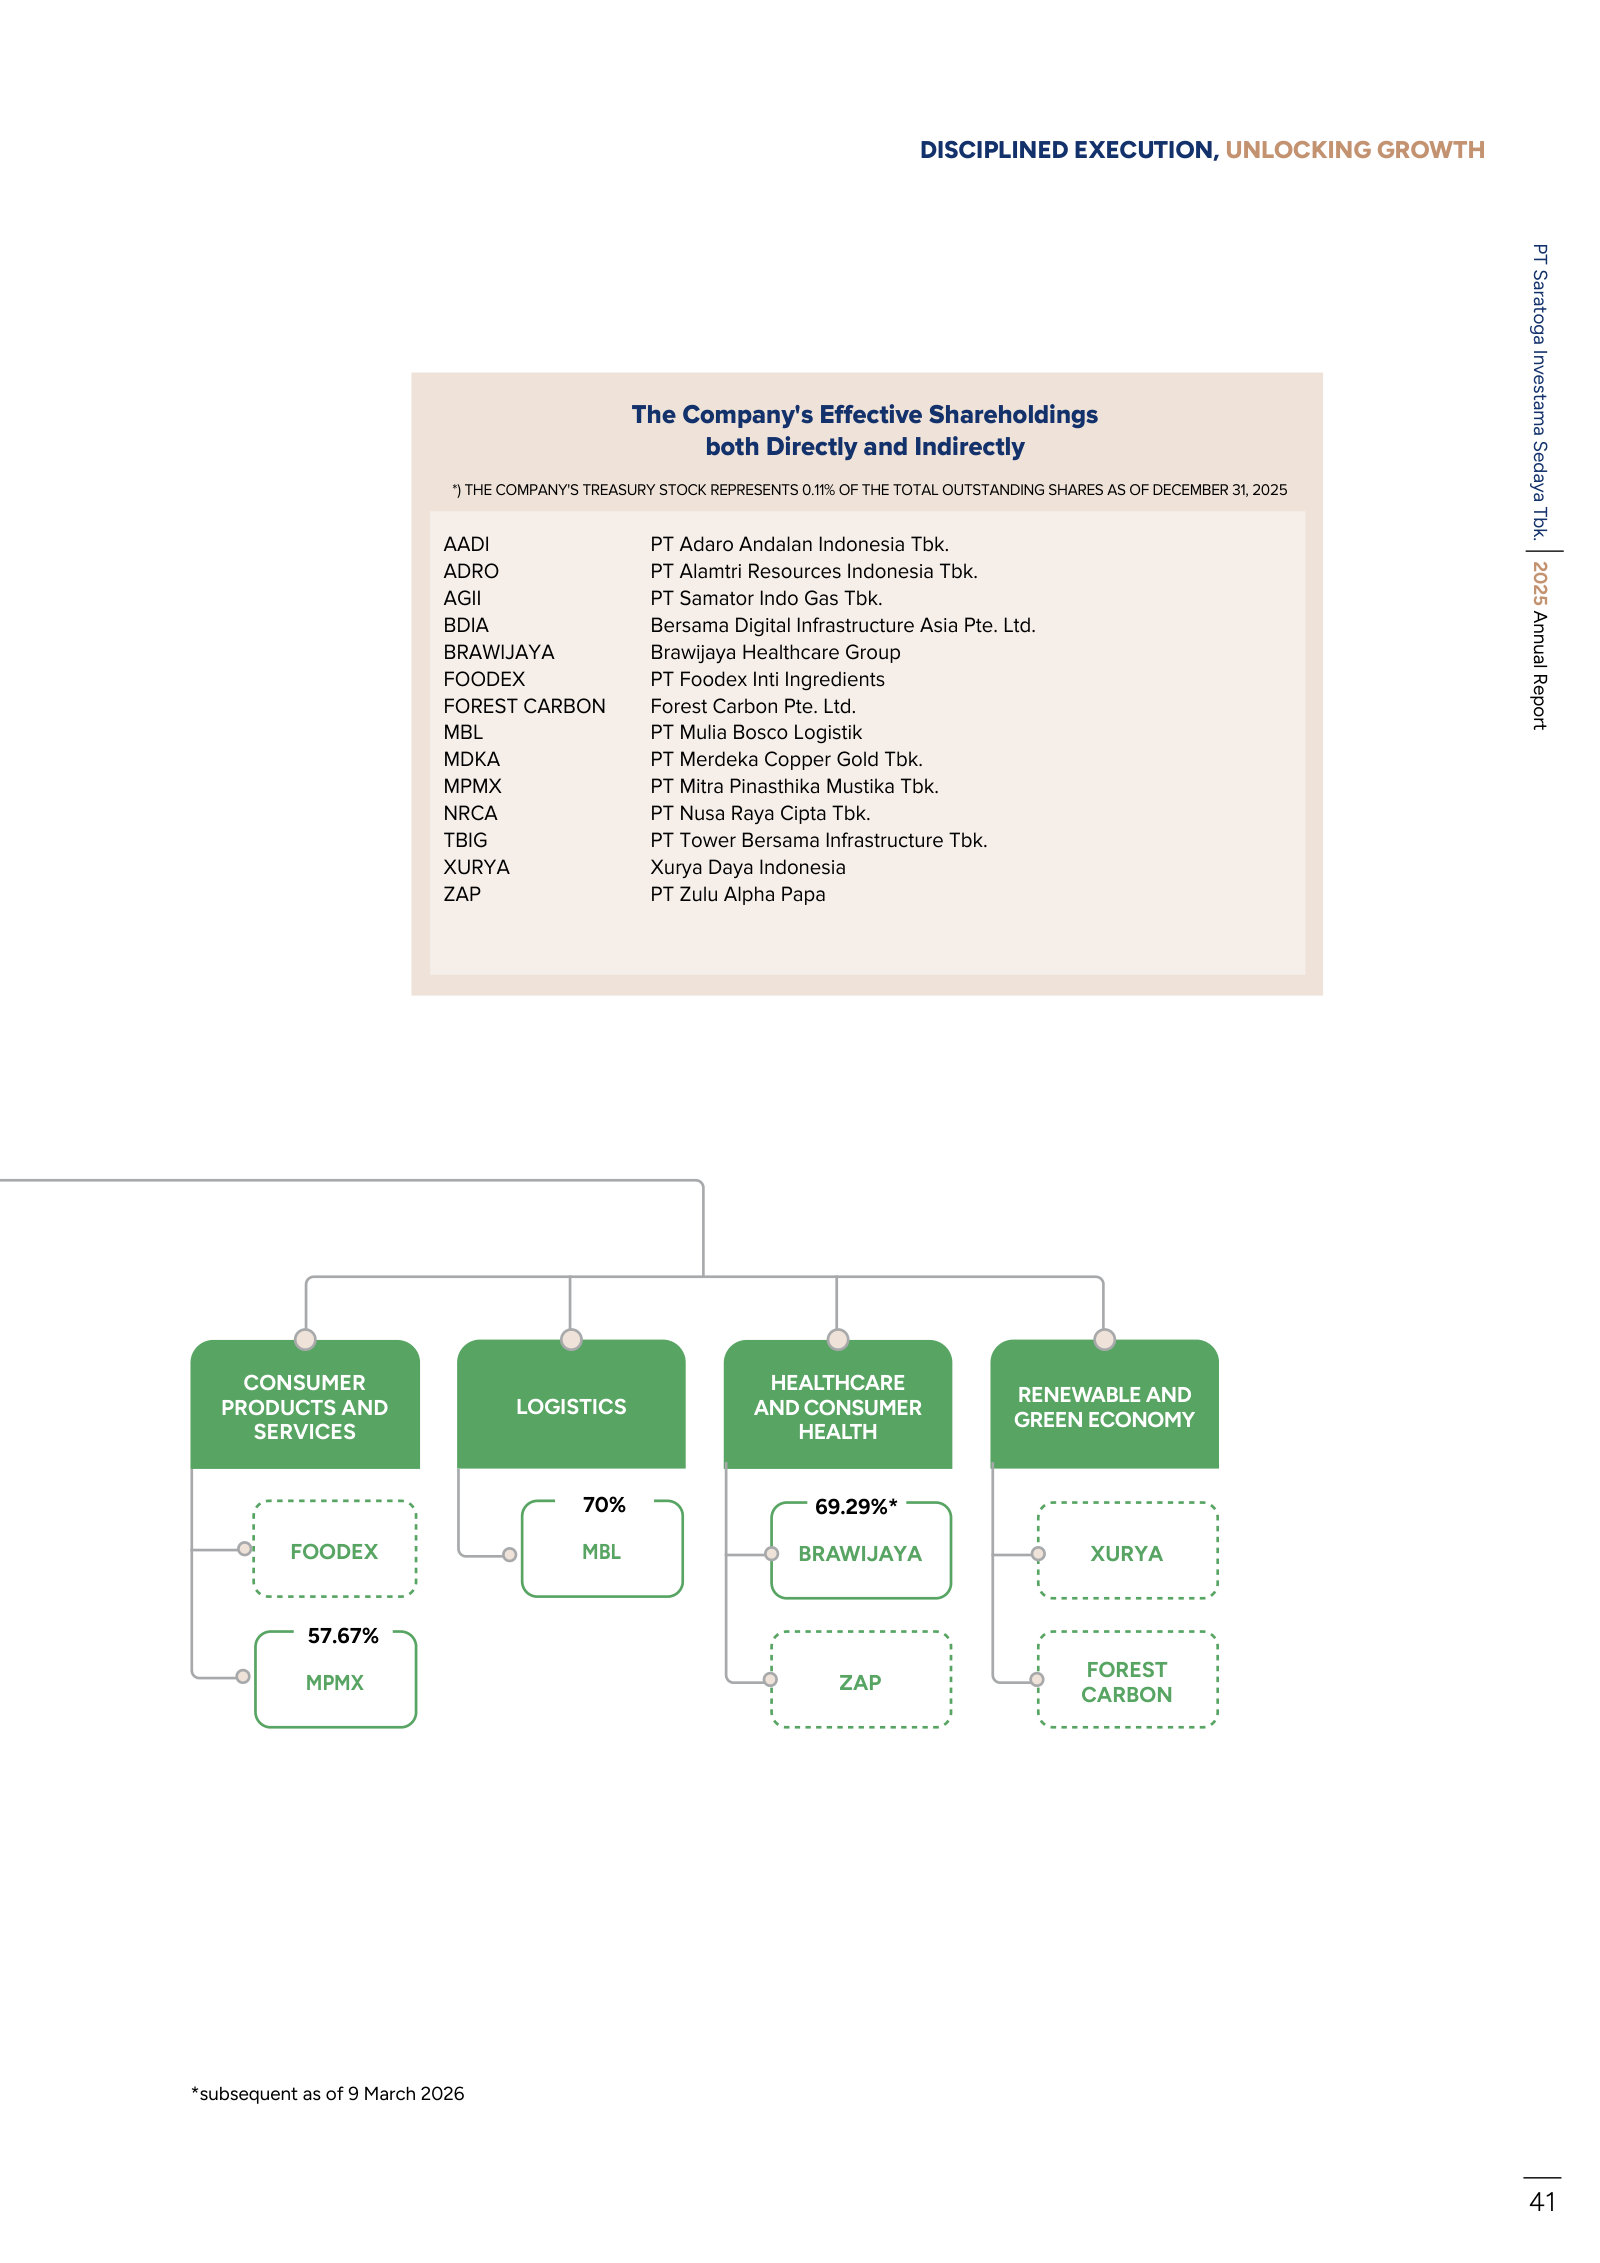
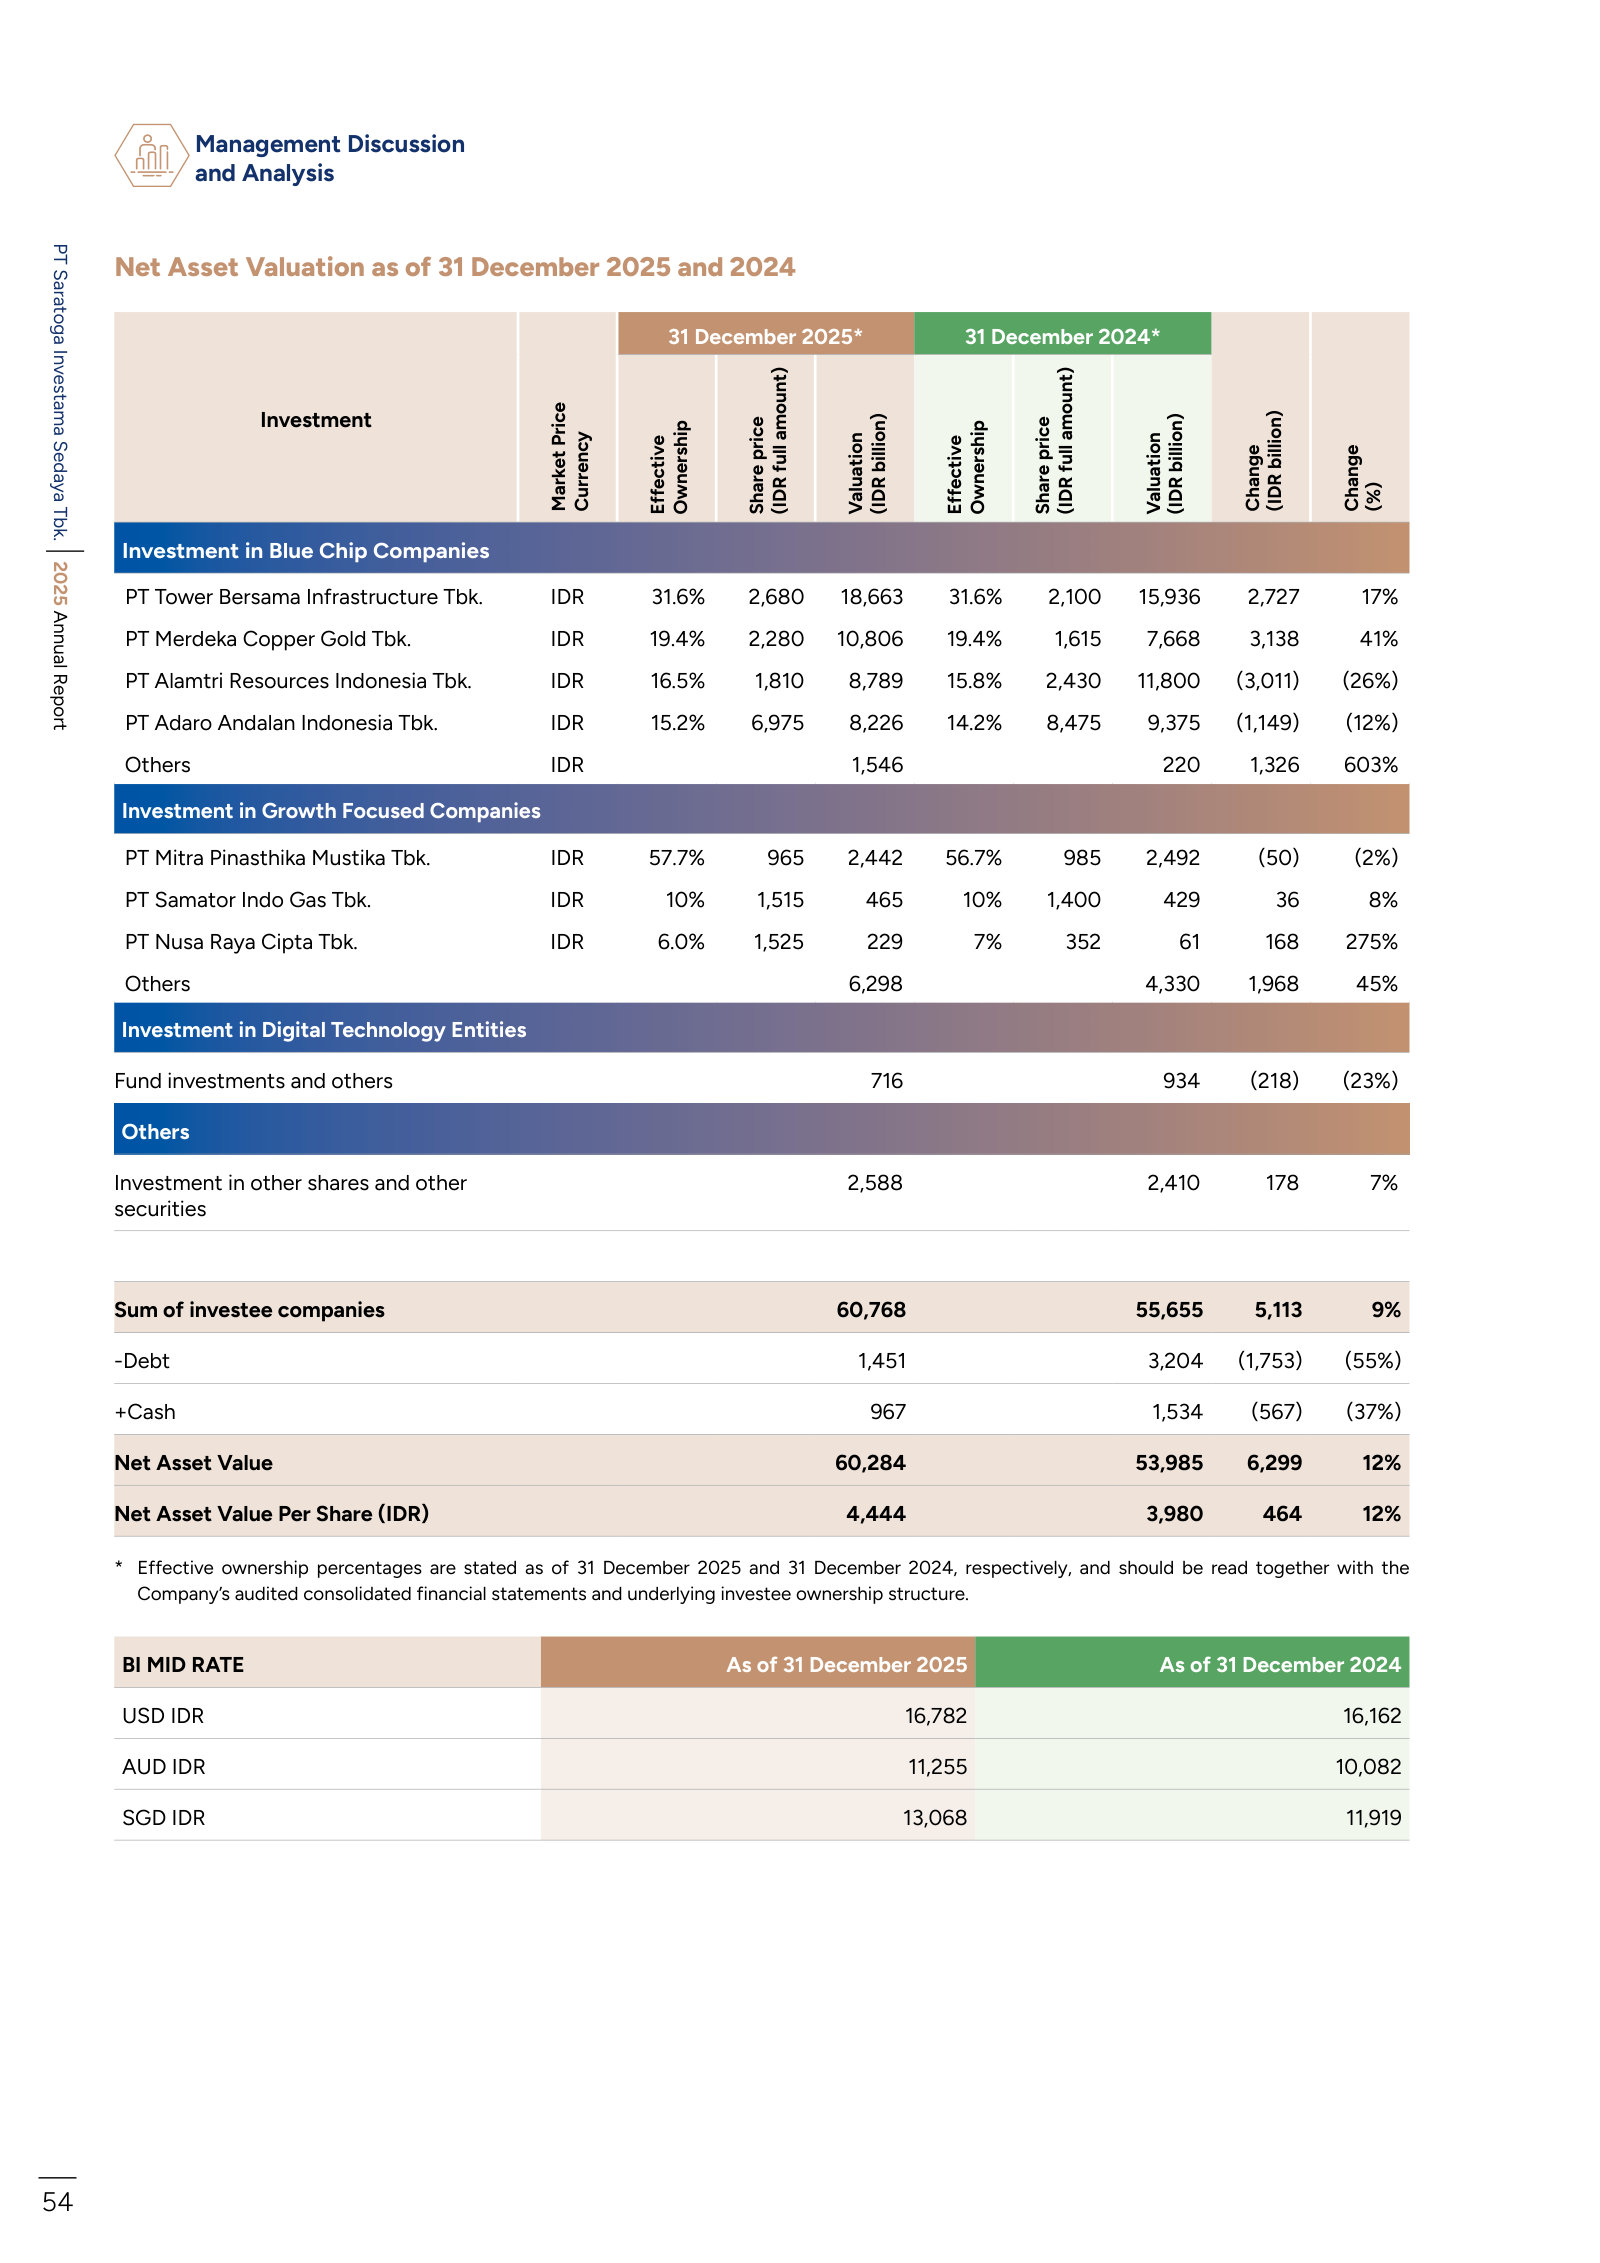
2025 Annual Report — performance, structure and NAV exhibits — FY2025
The deck stops at January 2025; these are the annual report's chart and diagram pages, carrying the current portfolio list, ownership map and the full sum-of-the-parts NAV. · Open the full document →
Investor Presentation — November 2024 (appendix) — November 2024
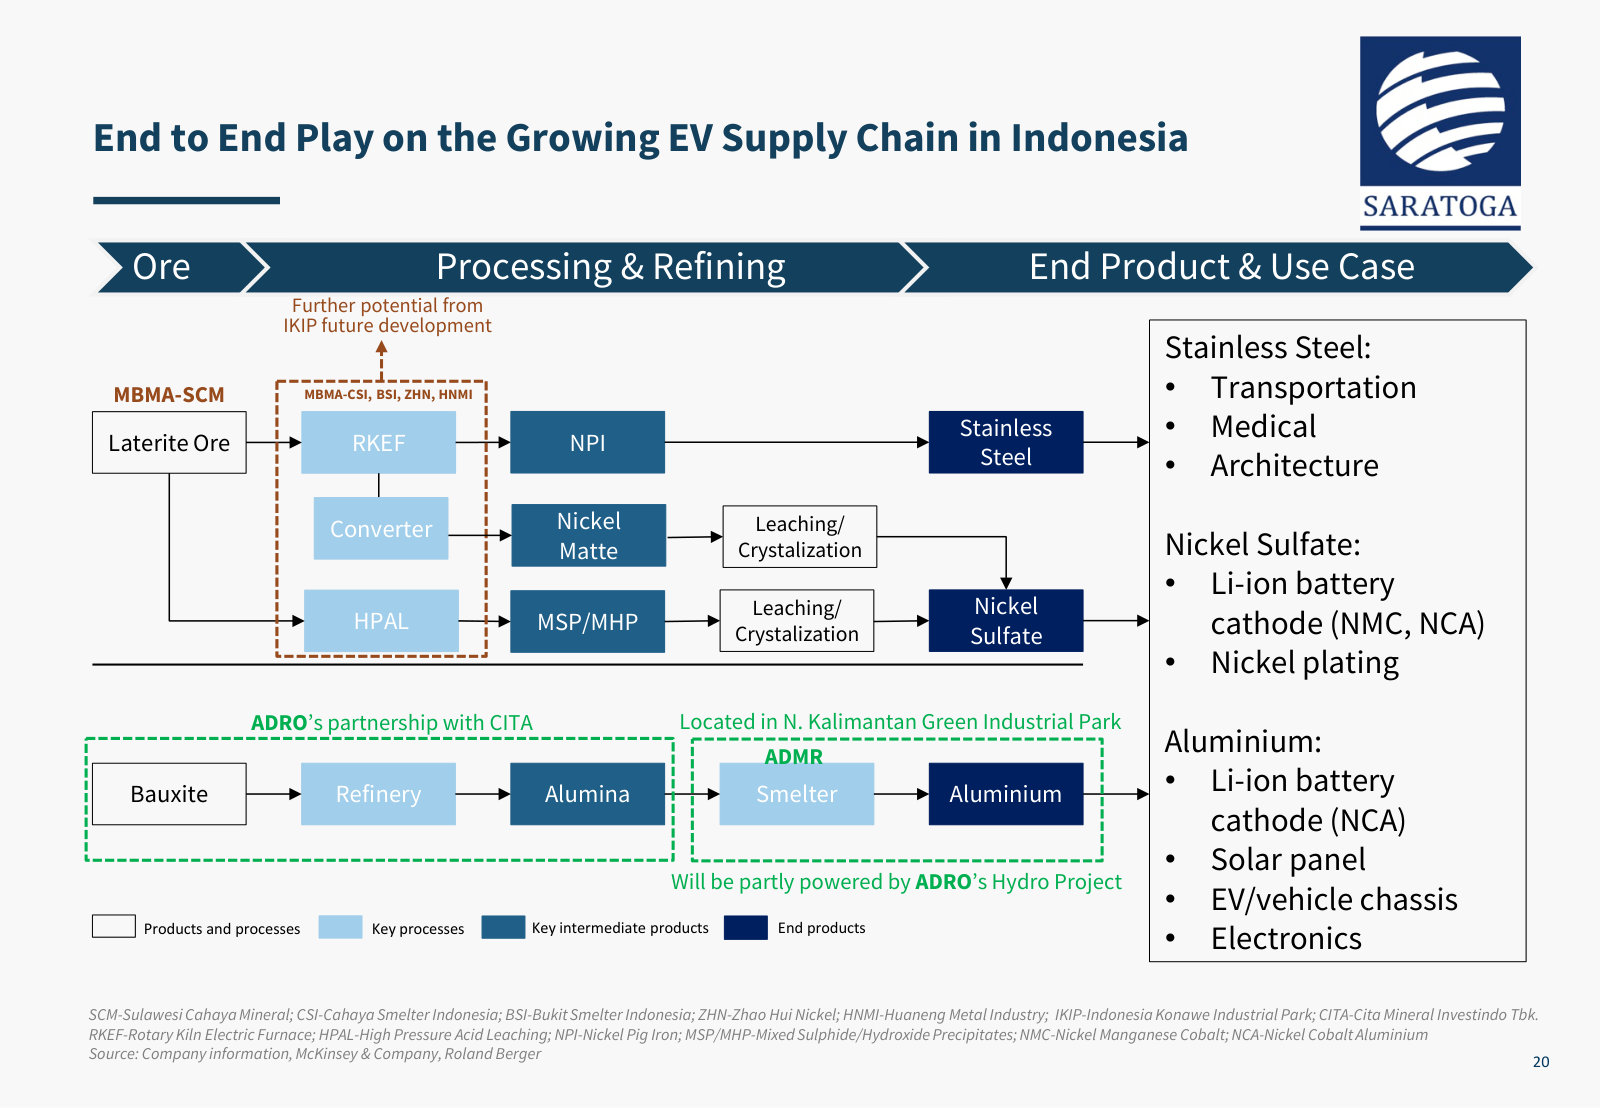
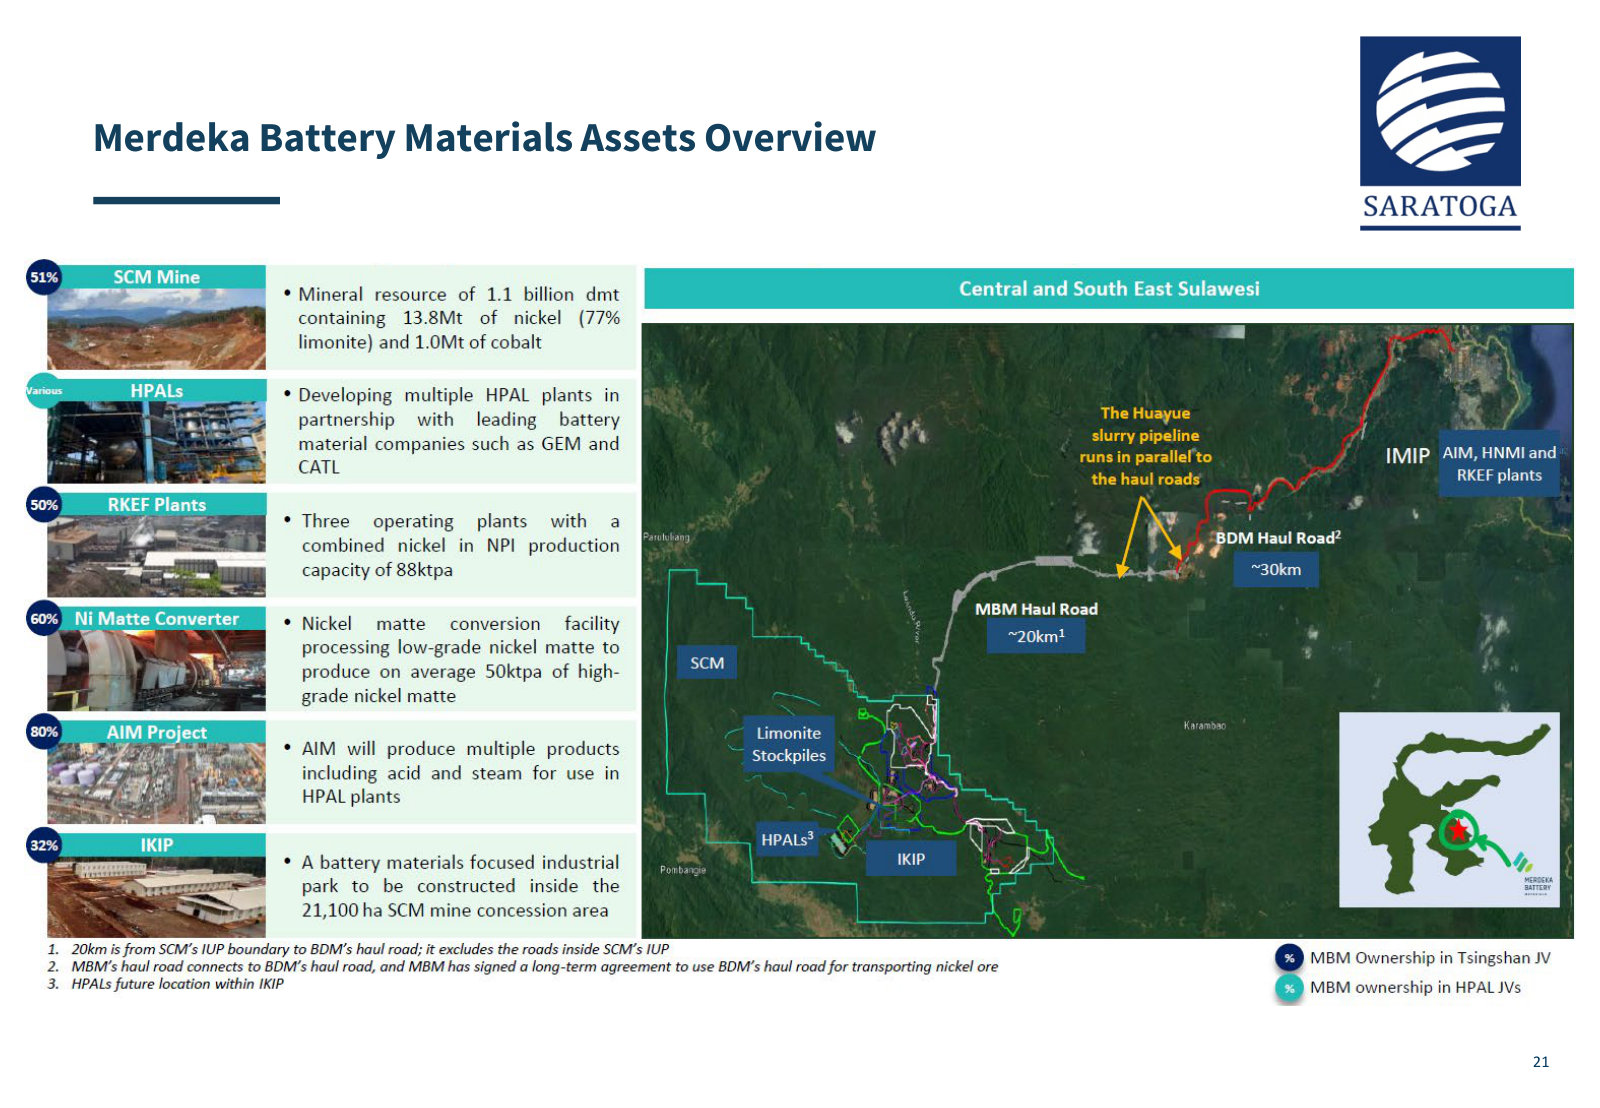
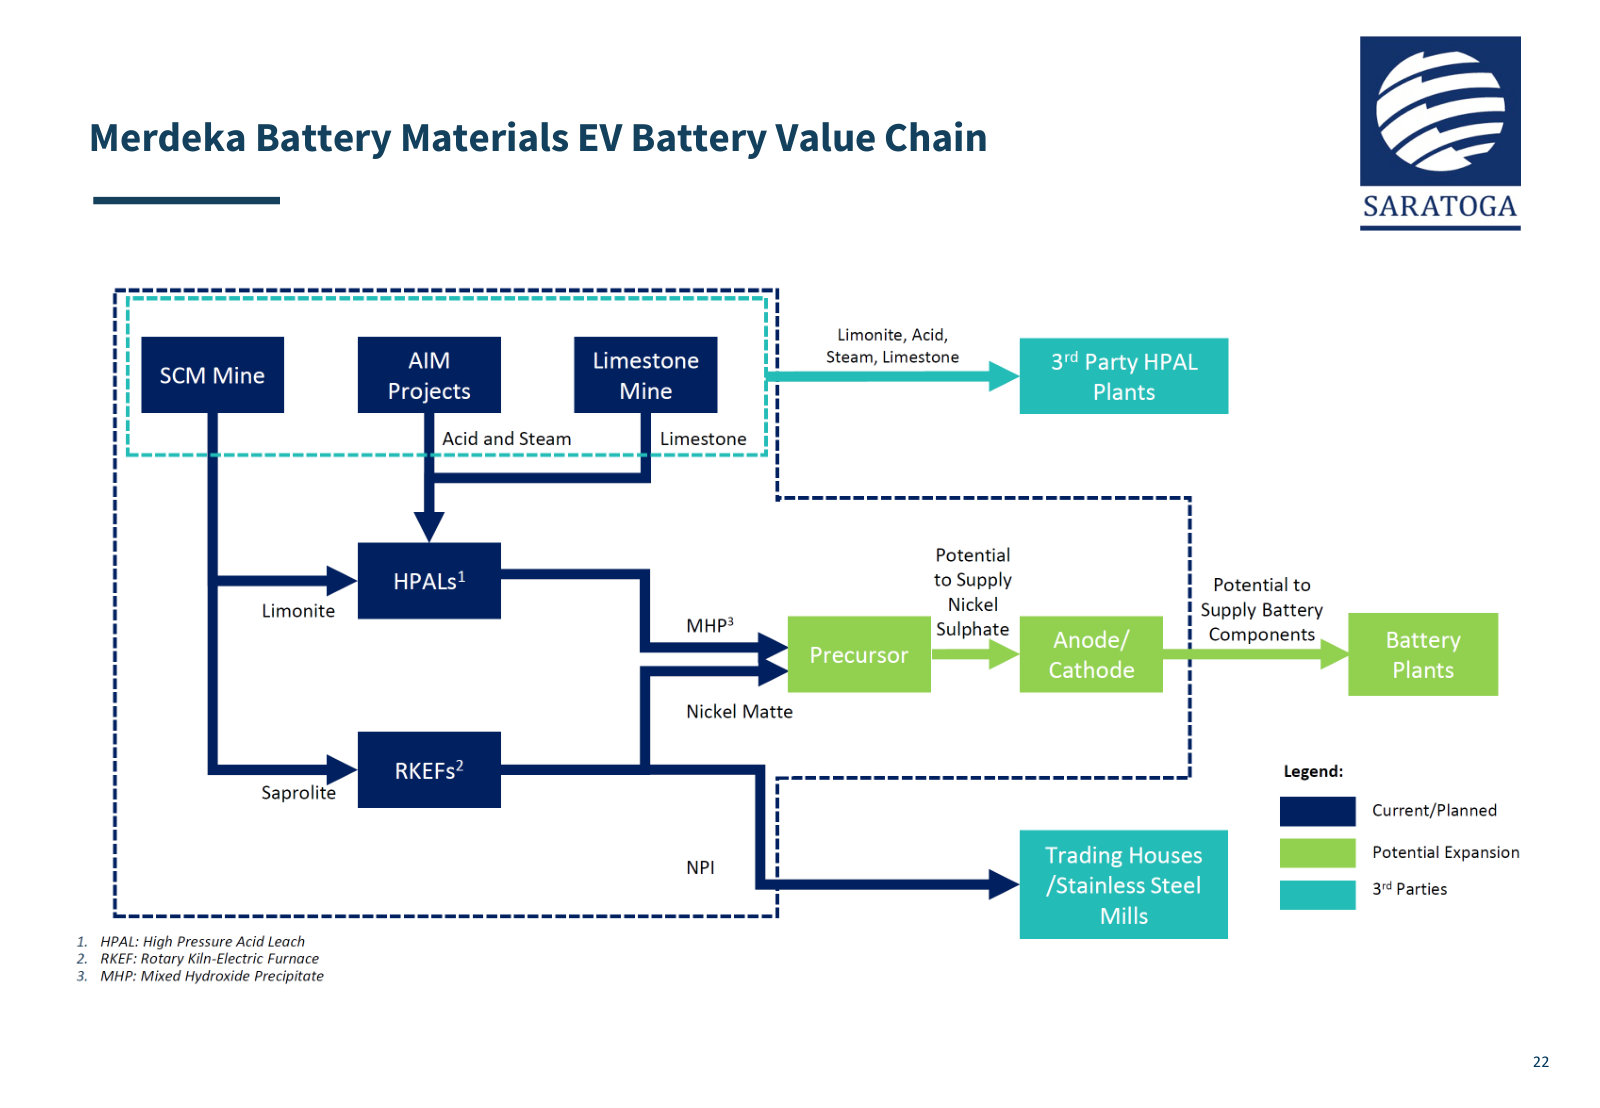
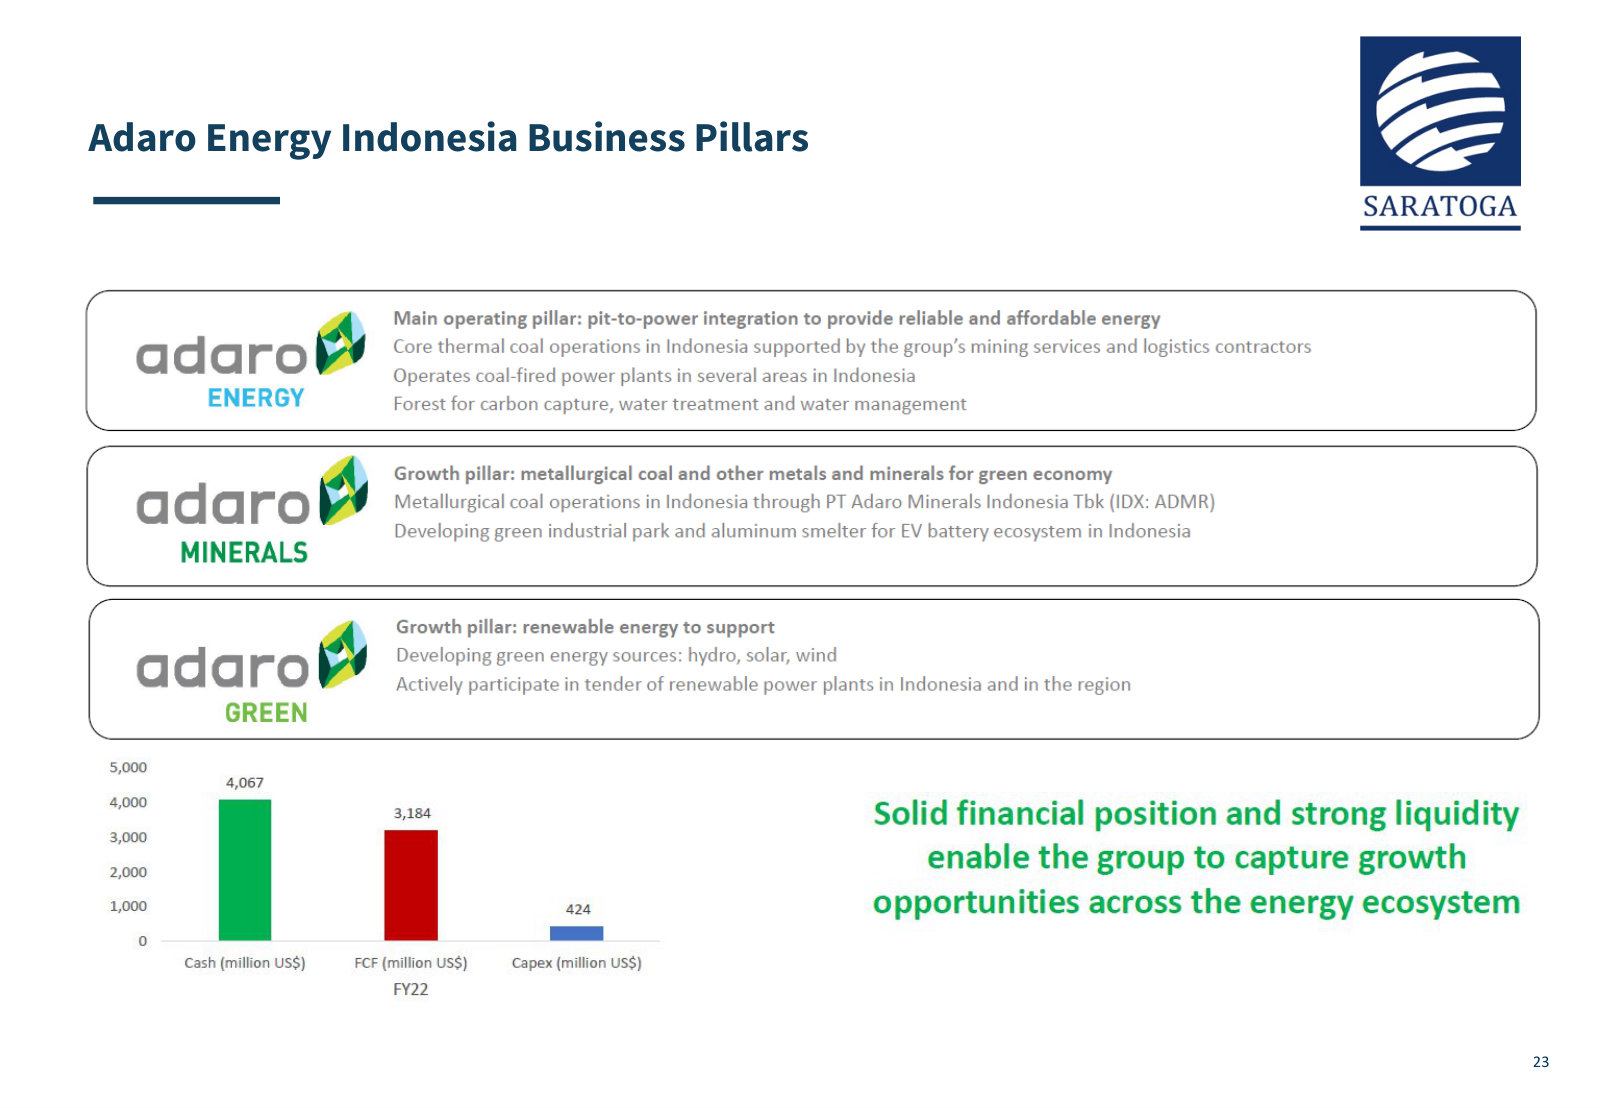
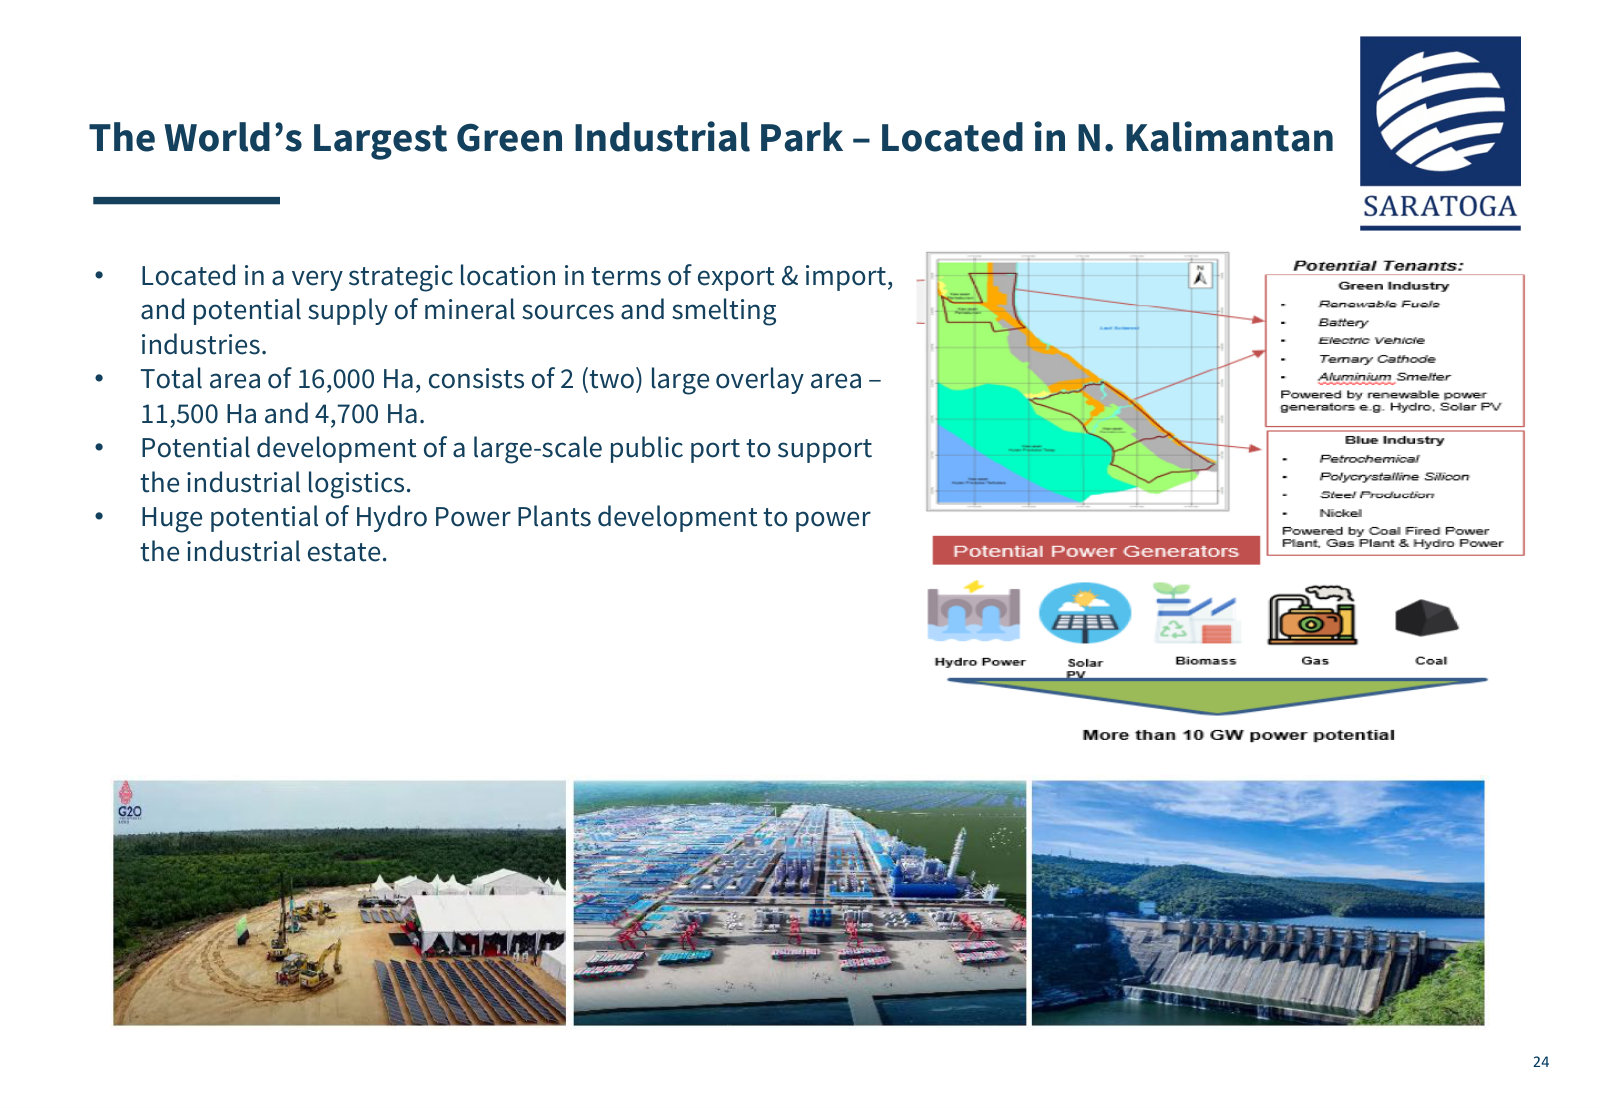
The core of this deck was superseded in January 2025, but its appendix — dropped from later editions — is the only place management maps the nickel and aluminium value chains its holdings sit in. · Open the full document →
More from management
AGM and EGM Material 2026 — 2026 · 27 pages · Management's own summary of FY2025 signed off for shareholders, plus the treasury-share and LTIP allocation put to the May 2026 vote. · Open →
AGM and EGM Material 2025 — 2025 · 47 pages · The full board slate reappointed in 2025 with candidate profiles, and the articles-of-association amendment passed alongside it. · Open →
Investor Presentation — August 2024 — August 2024 · 25 pages · The August edition of the same deck, on 1H24 figures — useful only to see what management was saying before the Brawijaya build-out. · Open →
AGM and EGM Material 2024 — 2024 · 31 pages · The FY2023 performance report and the buyback and treasury-share proposals put to shareholders after a year of NAV decline. · Open →
AGM and EGM Material 2023 — 2023 · 30 pages · The FY2022 report and the LTIP and share-buyback resolutions that set up the treasury-share programme still running today. · Open →
PT Saratoga Investama Sedaya Tbk's annual reports contain management's most considered account of the business. These are the sections, passages and visual pages worth opening in the originals preserved in Sources.
PT Saratoga Investama Sedaya Tbk — FY2025 Annual Report — FY2025
The latest full account of a holding company whose reported profit is almost entirely the mark-to-market of ten investee stakes. · Open the full document →
Saratoga in Brief — p. 12 · Read the full section →
Defines the business in management's own terms: an active investment company that invests, grows and monetizes minority stakes.
Who Saratoga is, then the three activities it labels Invest, Grow and Monetize.
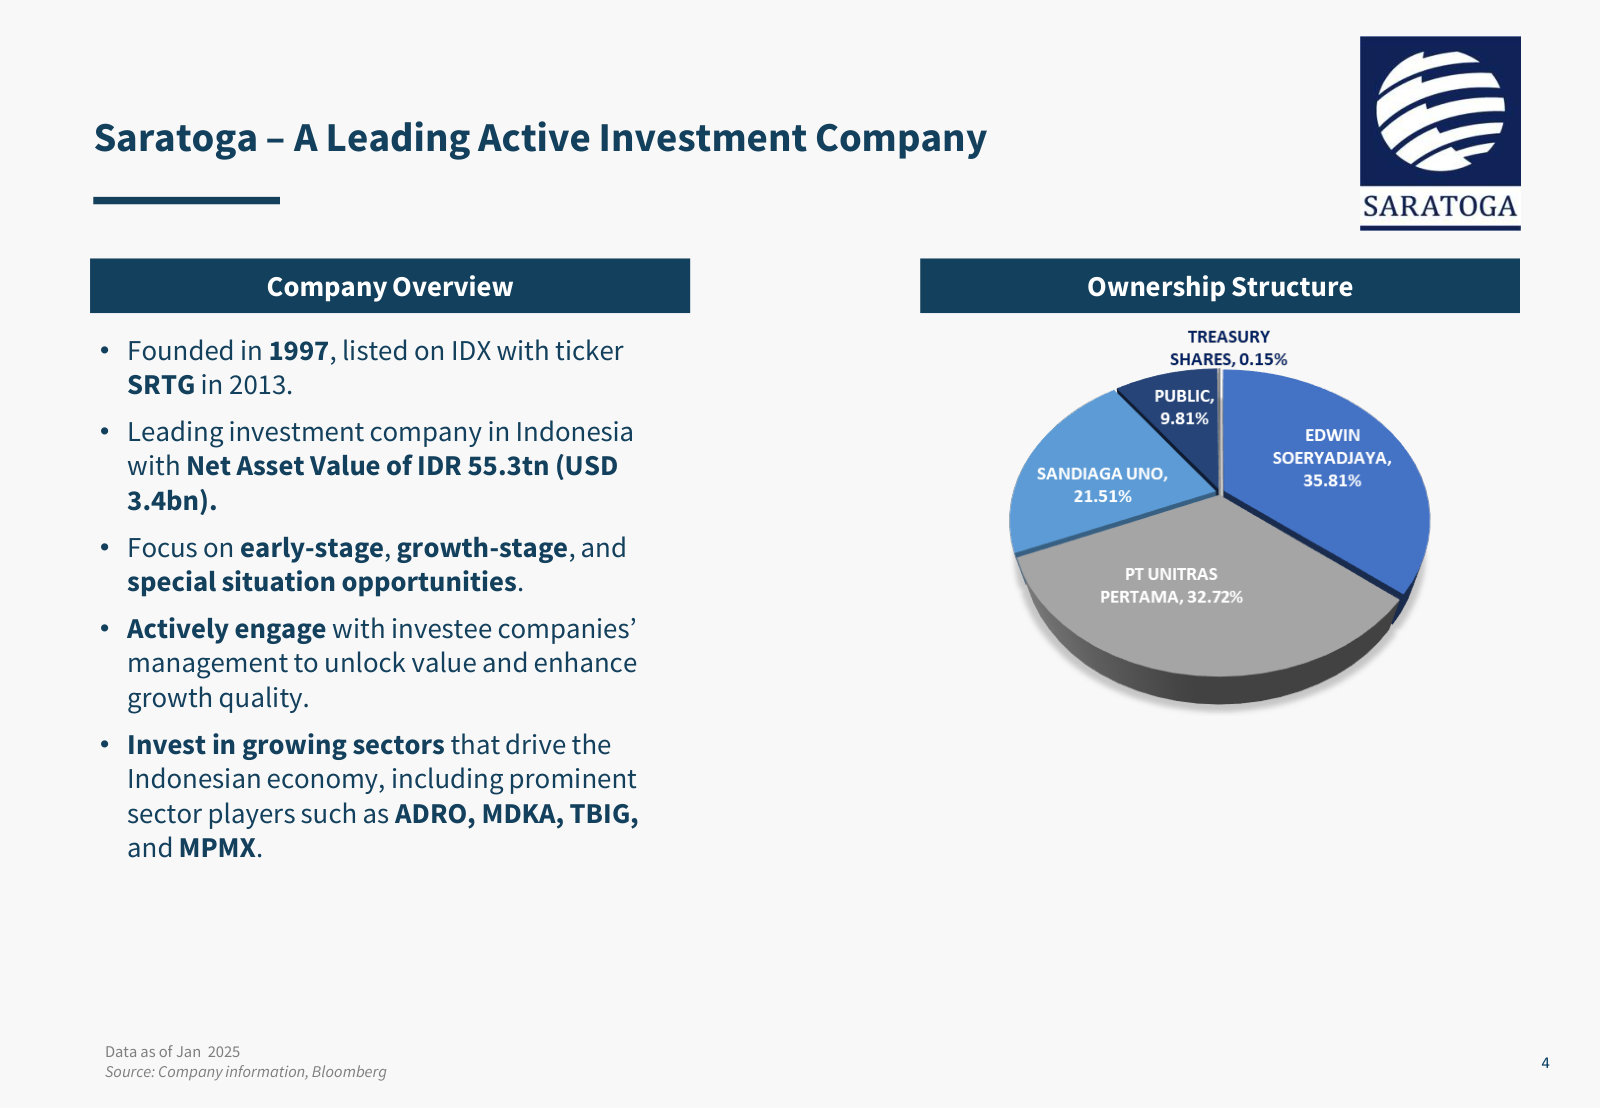
PT Saratoga Investama Sedaya Tbk. (IDX Code: SRTG) is a leading active investment company in Indonesia with nearly 3 (three) decades of investment experience since its establishment in 1997. Saratoga has built a strong track record across multiple economic cycles, supported by a disciplined and long-term investment approach. […] With a passion for excellence, we actively approach investment opportunities early on where significant value can be added. […] We actively support our investment, leverage our expertise in investment management, sector knowledge, and wideranging access to debt and equity capital markets, locally and internationally. […] We actively manage our investments and provide our investee companies with a broad range of capital market and strategic placement opportunities.
p. 12 · Read in context →
Report of the Board of Directors — p. 23 · Read the full section →
Management's own framing of 2025: where capital was rotated, and the NAV outcome it produced.
Portfolio Highlights — p. 29 · Read the full section →
The asset-by-asset walk — the only place the unlisted holdings, which have no market price, are described at all.
The ADRO/AADI separation that split the largest holding into two listed lines.
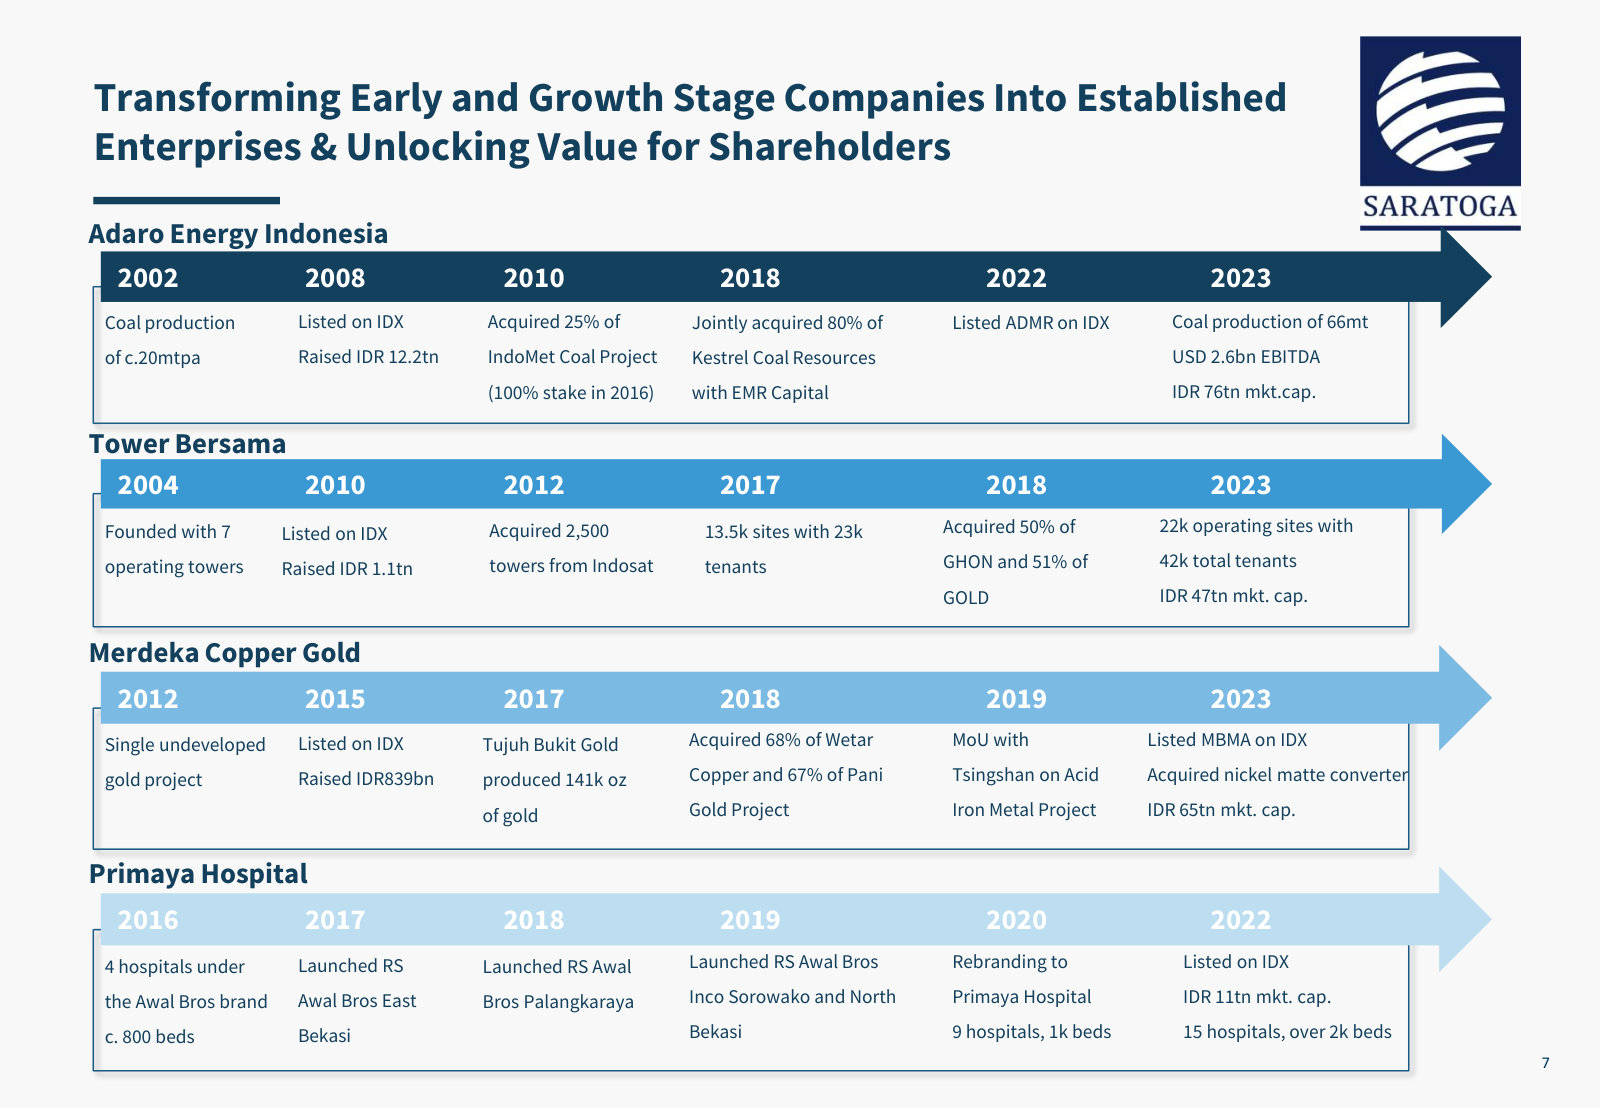
In late 2024, ADRO completed its strategic repositioning to focus on mineral processing and renewable energy. Following the separation of its thermal coal subsidiary, PT Adaro Andalan Indonesia Tbk. (AADI), the Company managed its portfolios to concentrate all resources on its metallurgical coal and minerals business operated through PT Alamtri Minerals Indonesia Tbk. (ADMR).
p. 30 · Read in context →
The Digital Realty 50:50 joint venture, the year's main unlisted development.
In March 2025, BDIA reached a significant strategic milestone with the formation of a 50:50 joint venture with Digital Realty, the world’s largest global provider of cloud- and carrier-neutral data center, colocation, and interconnection solutions. […] Through Digital Realty Bersama, the joint venture owns and operates a connected data center campus in Jakarta, consisting of multiple strategically located facilities.
p. 33 · Read in context →
Review of Operations — p. 54 · Read the full section →
States plainly that income is dividends plus fair-value change, then attributes the 180% swing in net gain to two share prices.
The income model, and the TBIG/MDKA re-rating behind the IDR4,140 billion net gain.
Saratoga’s income is principally derived from dividend receipts, realized gains on investment disposals, and changes in the fair value of investments. […] In 2025, Saratoga recorded a net gain IDR4,140 billion from investments in shares and other securities, a significant improvement compared to 2024, when the Company recorded a gain of IDR1,478 billion. This turnaround was primarily attributable to the increase in the share price of PT Tower Bersama Infrastructure Tbk. and PT Merdeka Copper Gold Tbk.
p. 54 · Read in context →
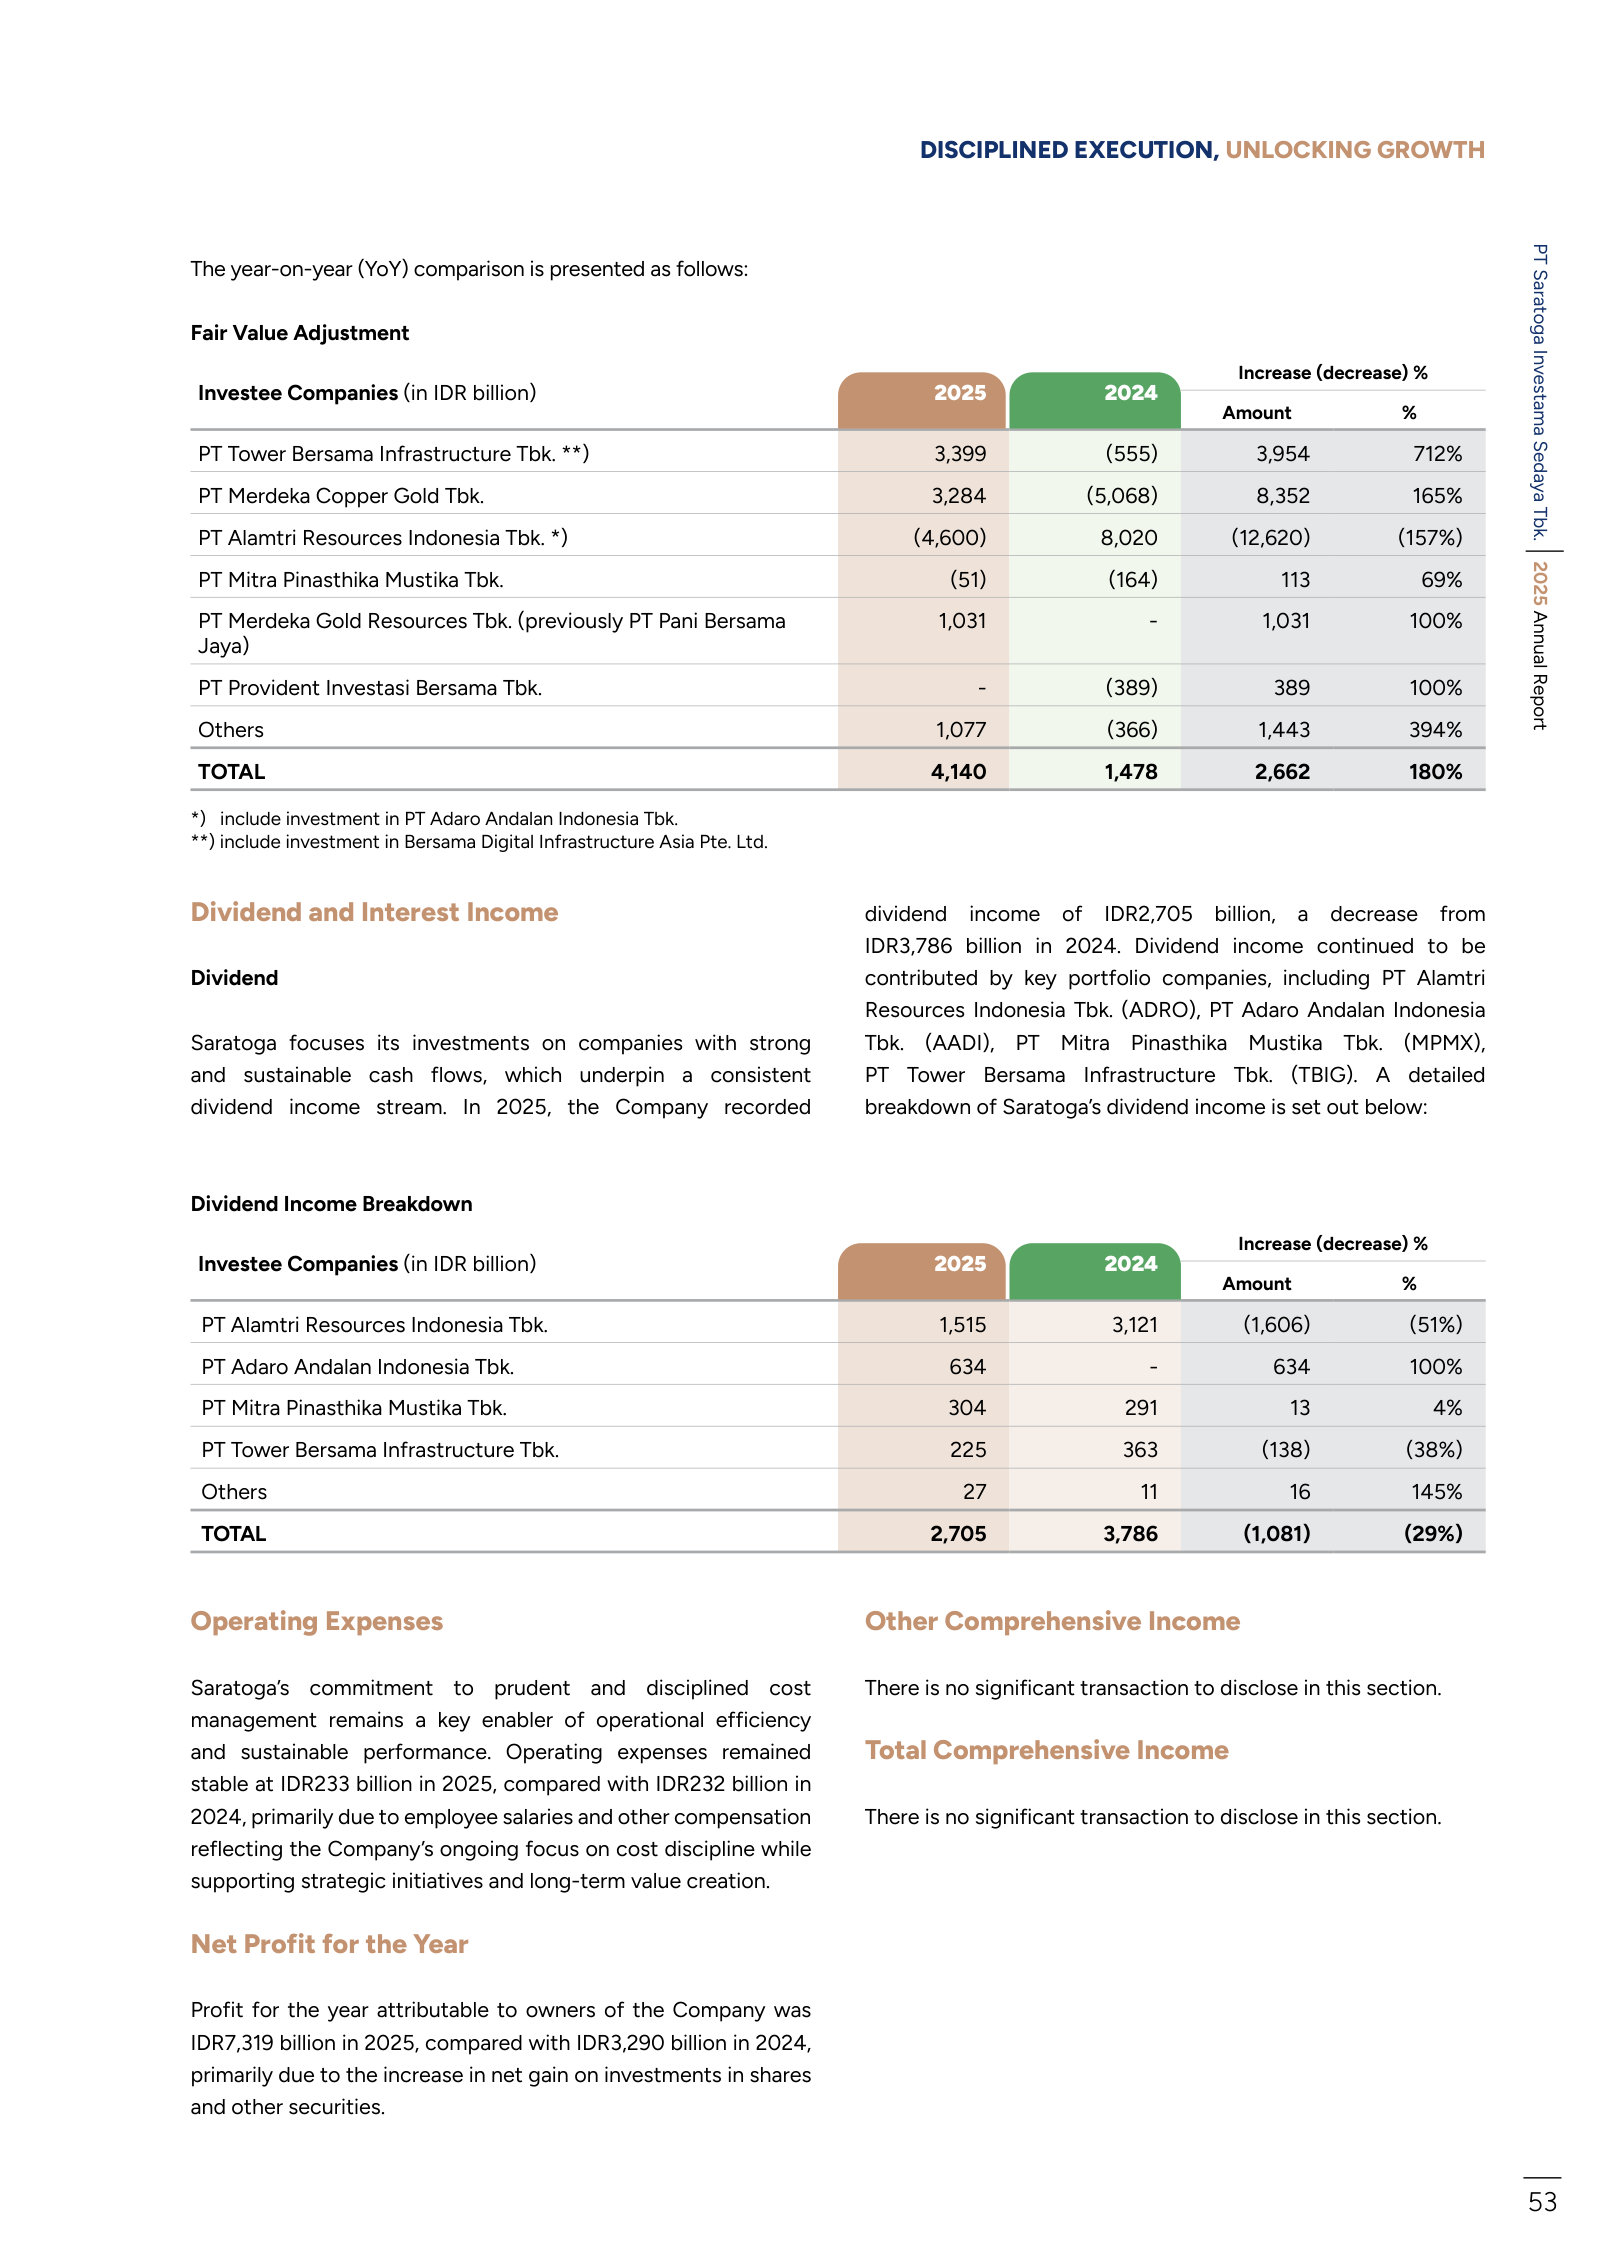
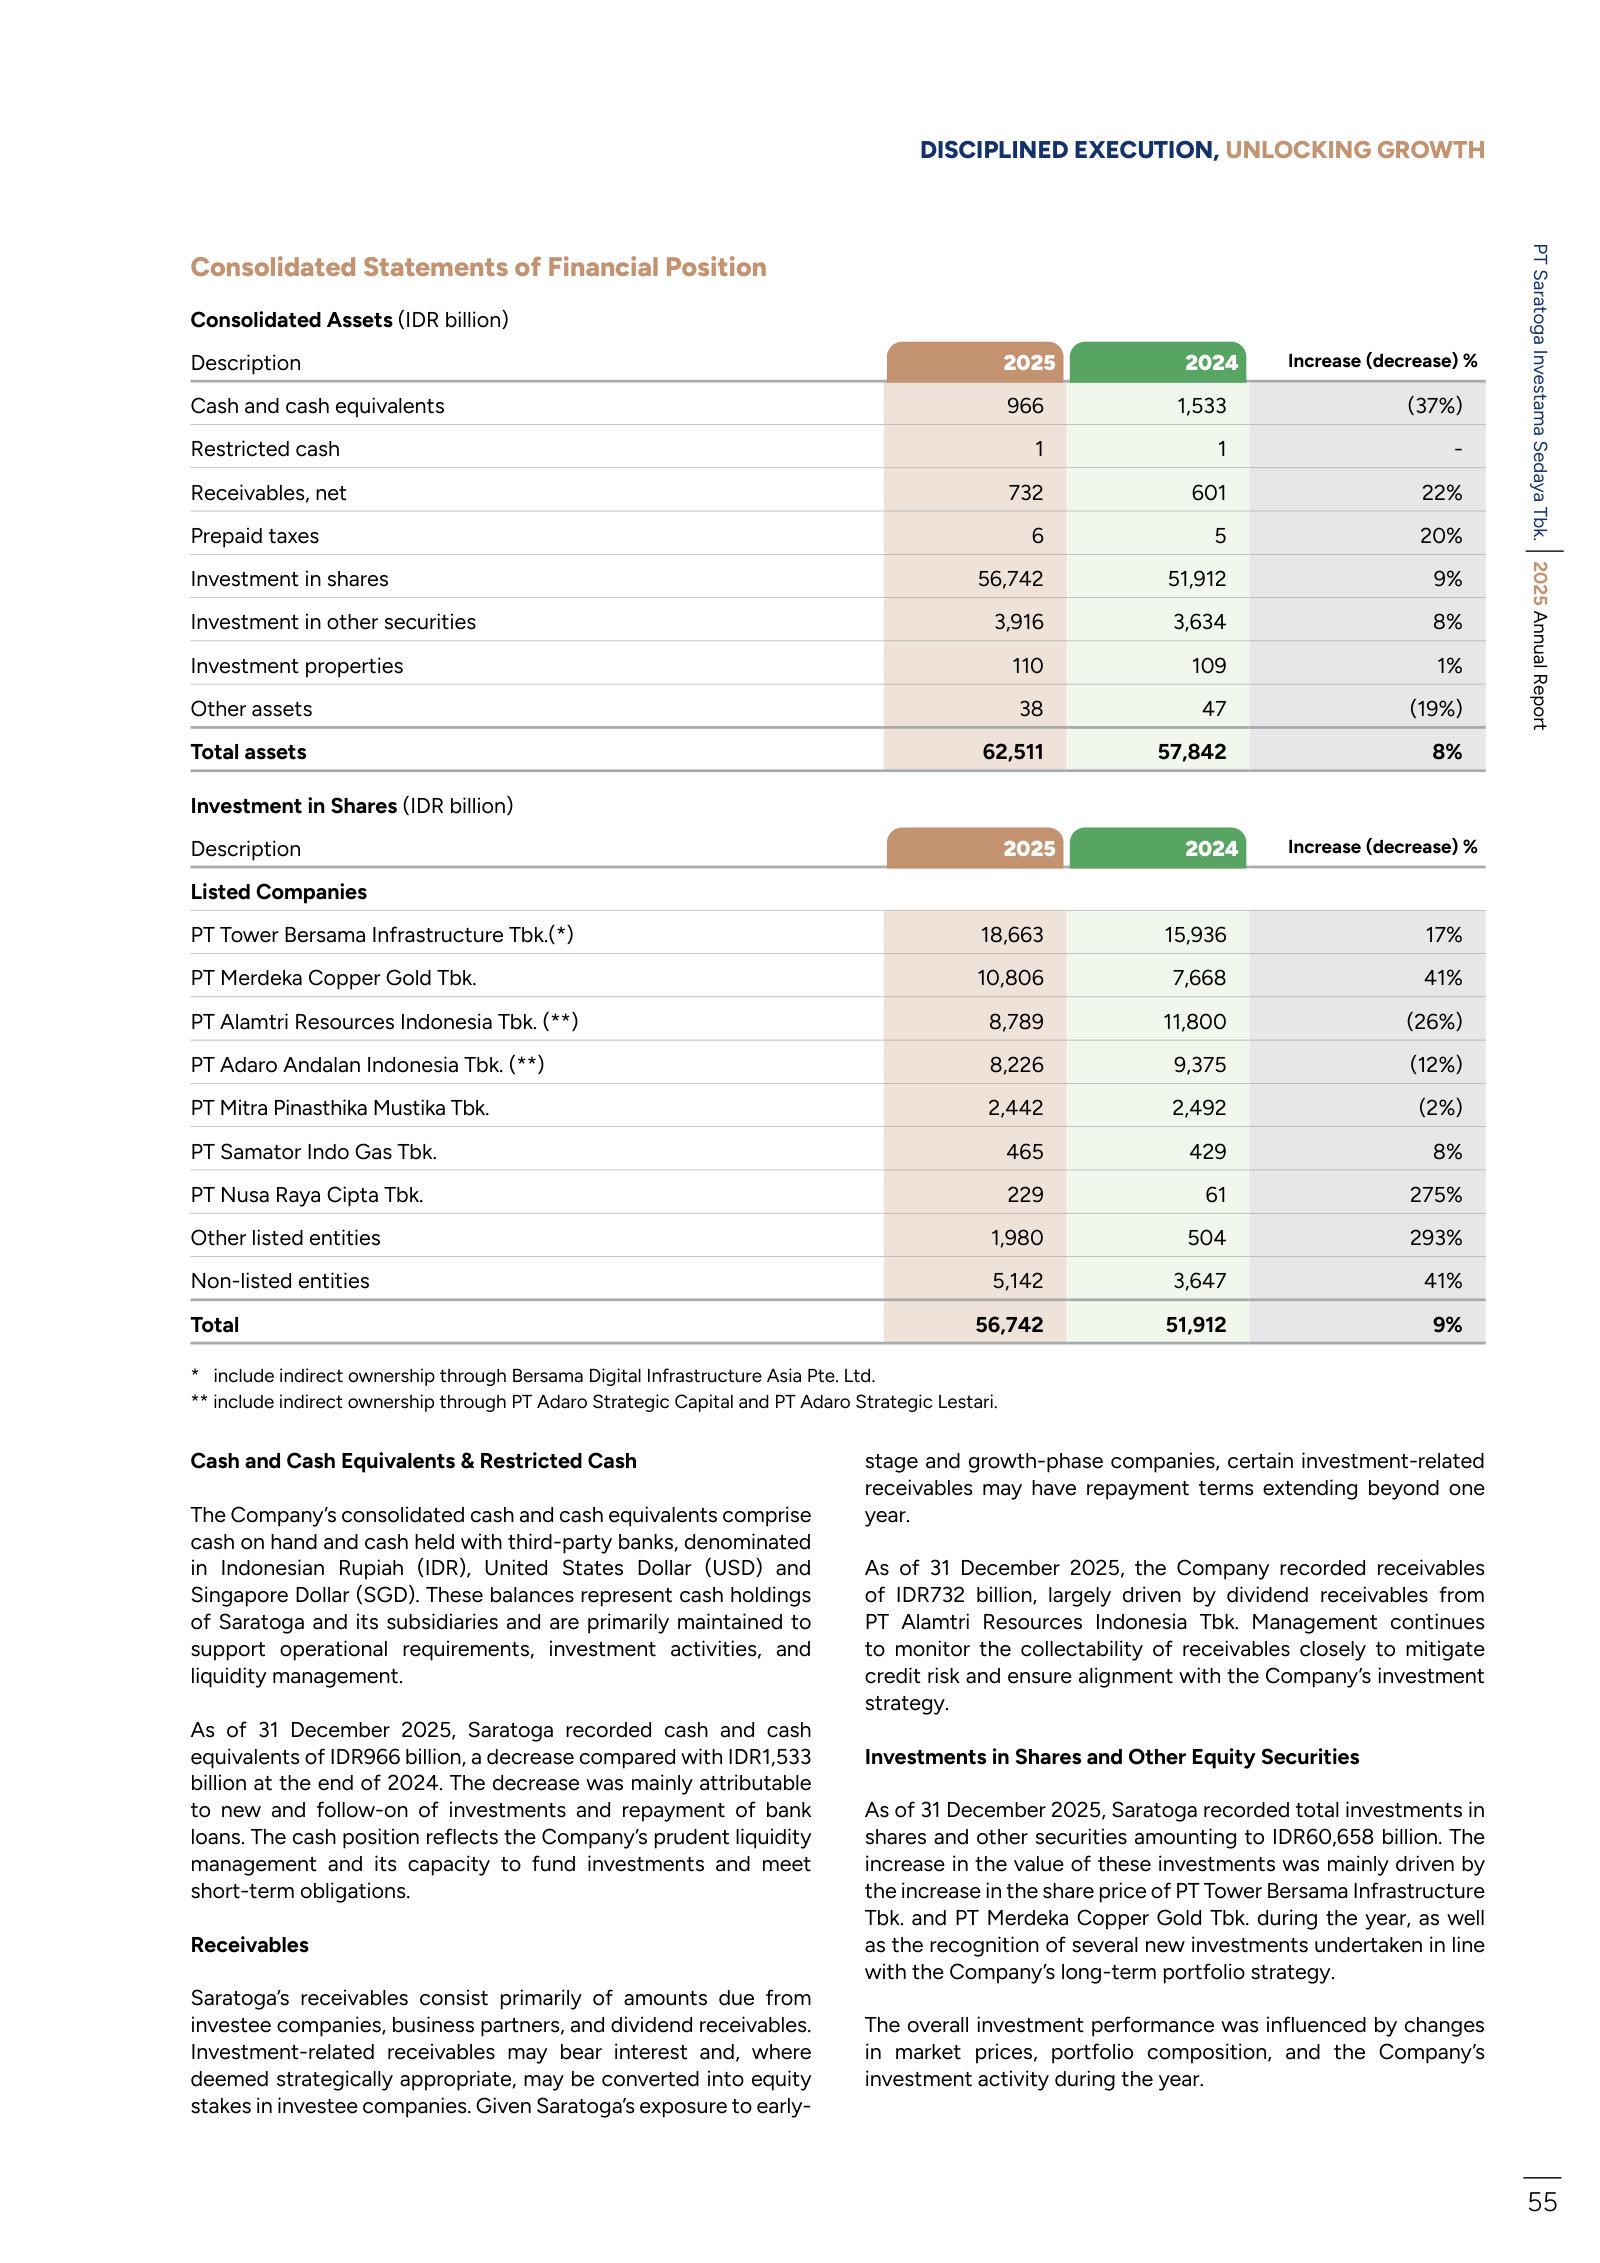
Investments in Shares and Other Equity Securities — p. 57 · Read the full section →
The portfolio at carrying value, holding by holding — the balance sheet a holdco is actually judged on.
Ability to Service Debt — p. 59 · Read the full section →
How a company with no operating revenue funds itself: dividends, divestments and interest, against a 0.8% loan-to-value.
Borrowings more than halved to IDR1,450 billion; LTV down to 0.8% from 3.0%.
As of 31 December 2025, the Company’s total borrowings declined to IDR1,450 billion, compared with IDR3,214 billion as of 31 December 2024, primarily due to the repayment of bank loans. […] As of 31 December 2025, the Company’s loan-to-value (LTV) ratio declined to 0.8% compared to 3.0% in 2024.
p. 59 · Read in context →
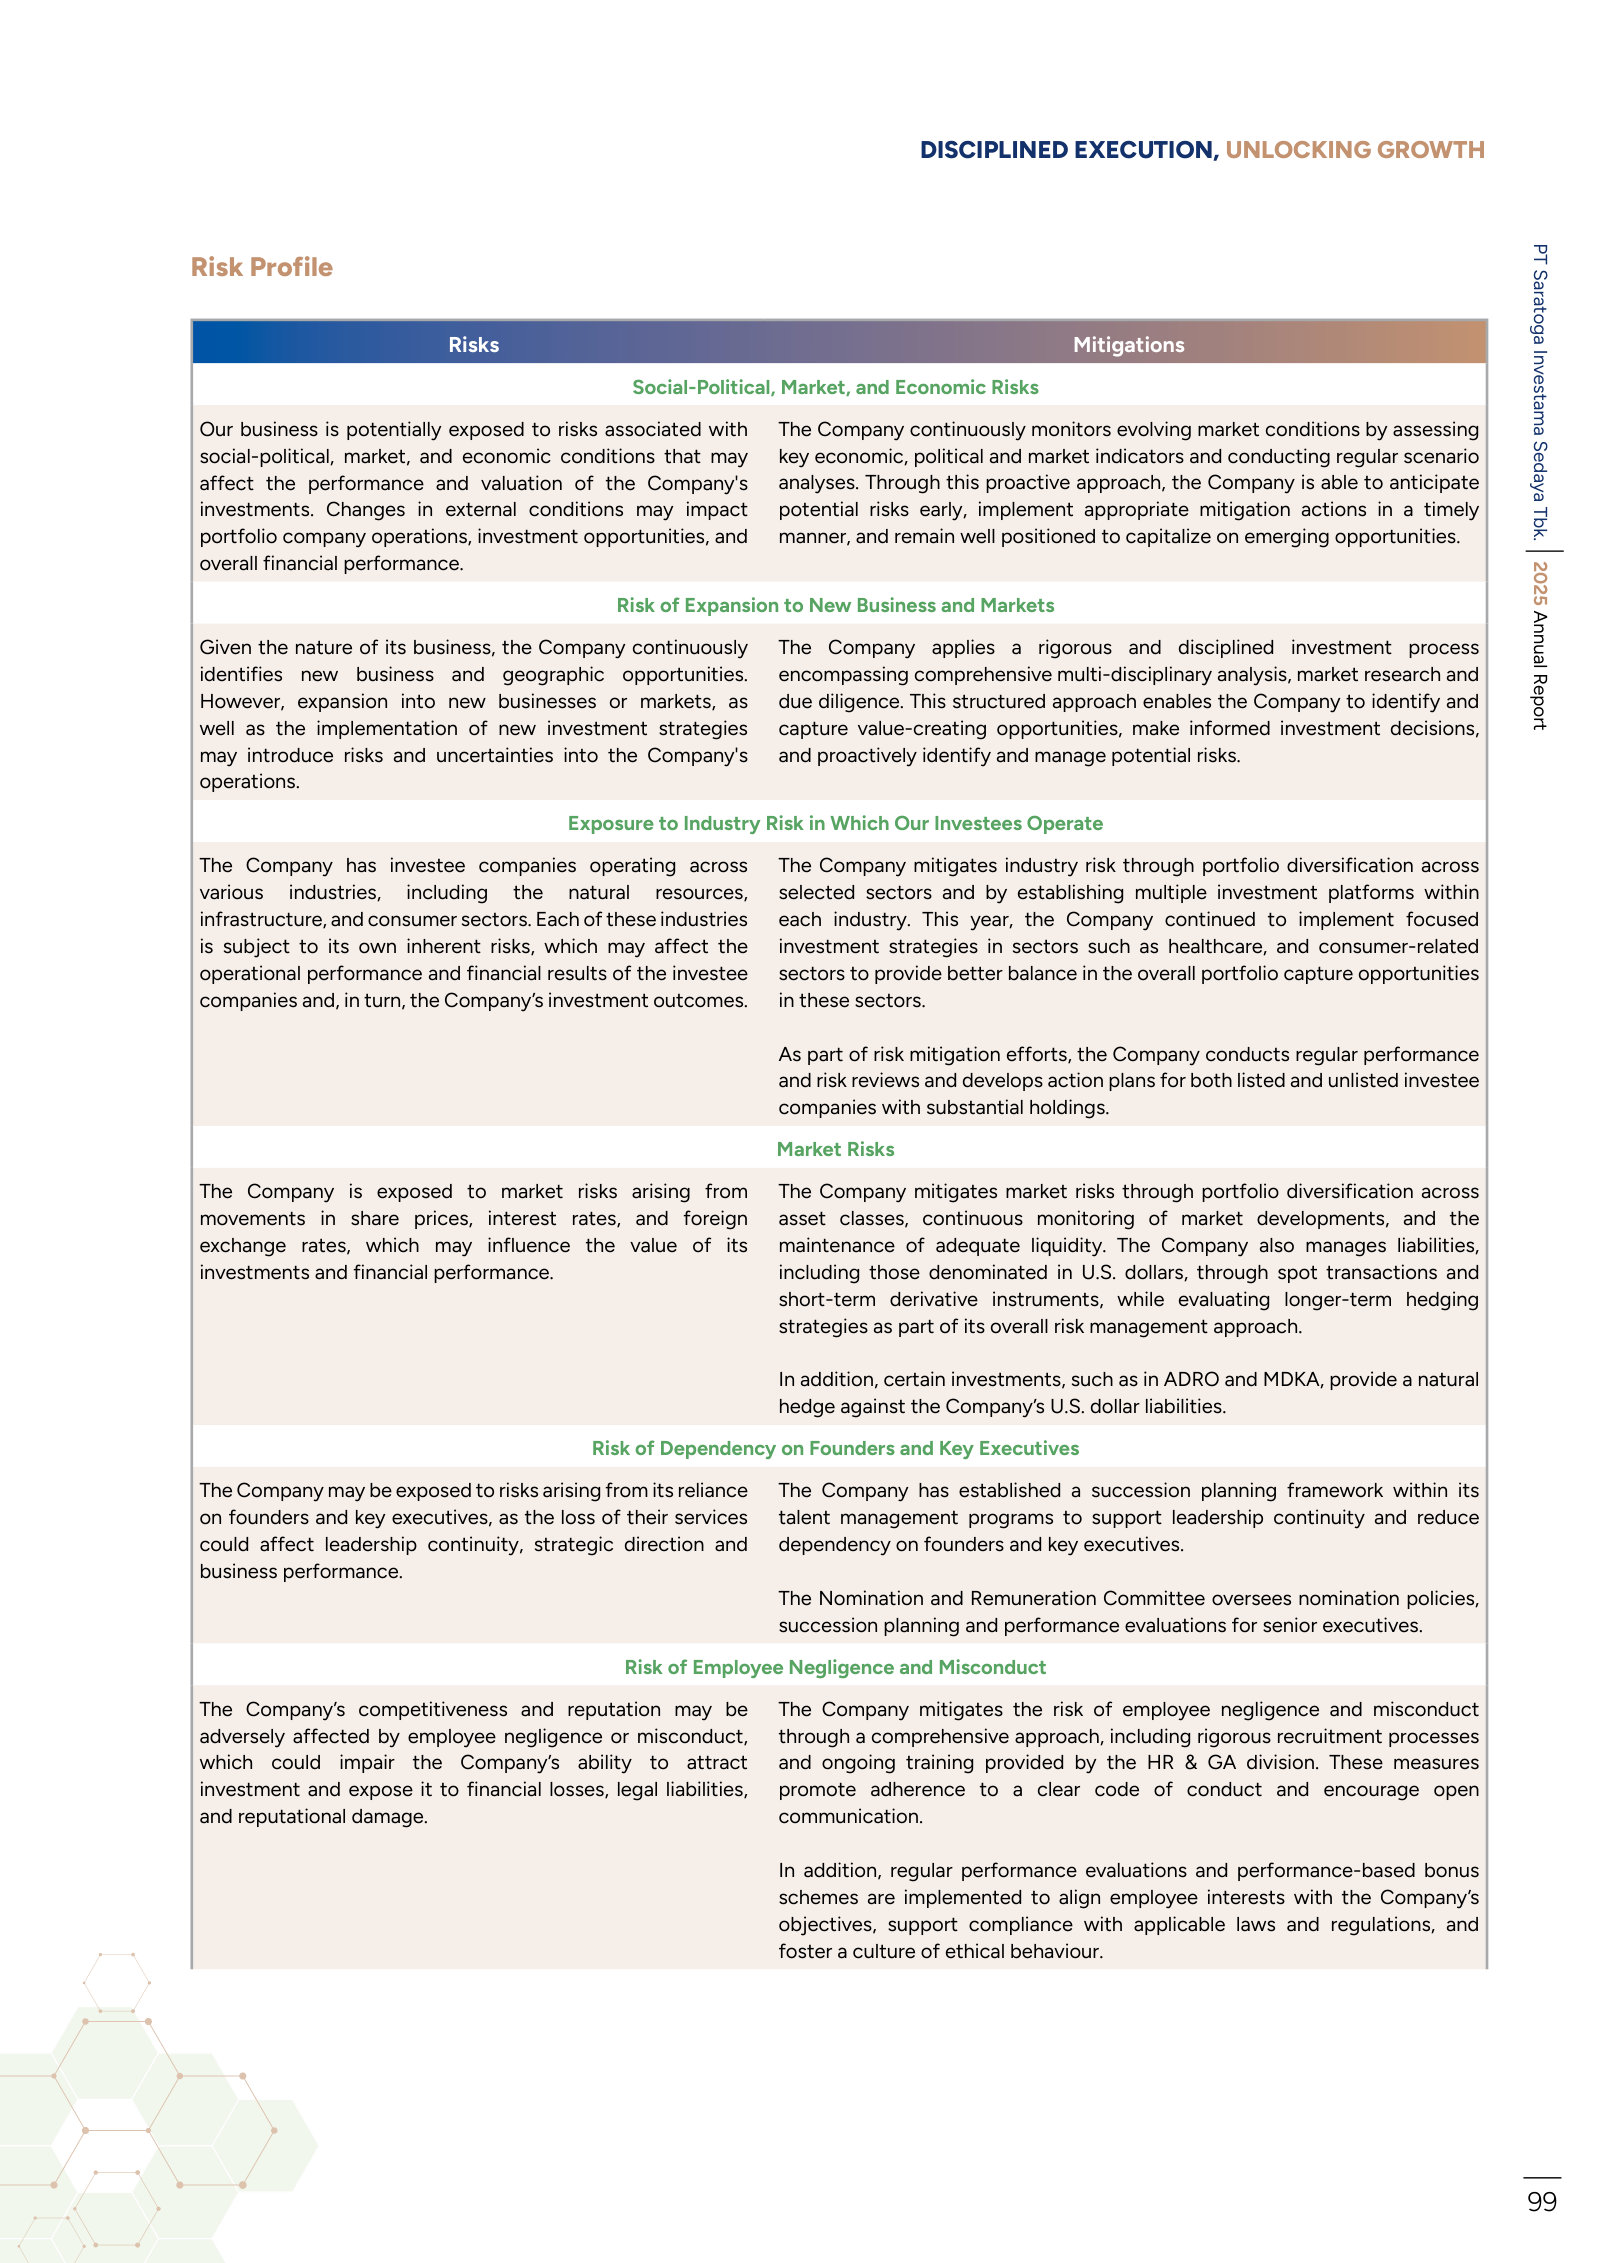
Risk Profile — p. 101 · Read the full section →
Two risks specific to this structure: it inherits every industry its investees operate in, and it depends on its founders.
Inherited industry risk across investees, and dependency on founders and key executives.
The Company has investee companies operating across various industries, including the natural resources, infrastructure, and consumer sectors. Each of these industries is subject to its own inherent risks, which may affect the operational performance and financial results of the investee companies and, in turn, the Company's investment outcomes. […] The Company may be exposed to risks arising from its reliance on founders and key executives, as the loss of their services could affect leadership continuity, strategic direction and business performance.
p. 101 · Read in context →
f. Principles of consolidation — p. 130 · Read the full section →
The accounting policy that defines the business model: as an investment entity Saratoga does not consolidate investees, it fair-values them.
Investment-entity status under PSAK 110: controlled entities, associates and JVs all carried at FVTPL.
The Company is a qualifying investment entity stipulated in PSAK 110, “Consolidated Financial Statements”, and accordingly investments in controlled entities - as well as investments in associates and joint ventures are measured at fair value through profit or loss (FVTPL) in accordance with PSAK 109 with the exception of subsidiaries that are considered an extension of the Company’s investing activities (i.e. a subsidiary that is non investment entity (in accordance with PSAK 110) which only provides investment management services to the Company). […] As a result, the Company only consolidates subsidiaries that are non-investment entities (in accordance with PSAK 110) which provide investment management services to the Company (see Note 1e for the list of consolidated subsidiaries).
p. 130 · Read in context →
Valuation of Level 2 and 3 Investments Carried at Fair Value — p. 167 · Read the full section →
The auditor's key audit matter: 55% of assets are valued by judgment rather than by an observable price.
IDR34.5 trillion of Level 2 and 3 investments, 55.26% of consolidated assets, valued on unobservable inputs.
As at 31 December 2025, the Group's investing activities result in various Level 2 and 3 (including investments measured at cost) investments in shares and other securities totaling IDR 34,543,686 million, representing 55.26% of the total consolidated assets. Out of those in Level 2, a total of IDR 25,485,721 million are investments in entities that hold a direct ownership in publicly traded shares. […] Unlike investments in publicly traded equities whose prices are readily observable and therefore more easily independently corroborated, the valuation of these Level 2 and 3 investments is inherently subjective, often involves the use of inputs that are unobservable
p. 167 · Read in context →
PT Saratoga Investama Sedaya Tbk — FY2021 Annual Report — FY2021
Included for one reason: this is the year the segment definitions were replaced wholesale, and the report shows the bridge. · Open the full document →
17. Segment Information — p. 146 · Read the full section →
Sector segments (natural resources, infrastructure, consumer) were retired here for lifecycle buckets, with 2020 restated to match.
The three replacement segments — Blue Chip, Digital Technology, Growth Focused — as first defined.
The Company categories the segment information into 3 (three) main sectors which are the investment target of the Company.
These segments are determined based on the following considerations: […] 1. Blue Chip Companies
Companies included in this category are companies that have a national reputation, both in terms of quality, ability and reliability to operate profitably in various economic situations with good or bad conditions, usually listed as part of LQ45 on the Indonesia Stock Exchange.
2. Digital Technology Companies
Companies defined here are companies that place an emphasis on digitizing business processes and services through sophisticated information technology and systems.
3. Growth Focused Companies
Companies that included in this category are companies that are still in the process of developing both in terms of income, as well as increasing the number of workers so that they can become bigger in the future.
p. 146 · Read in context →
More annual reports
PT Saratoga Investama Sedaya Tbk — FY2024 Annual Report — FY2024 · 167 pages · The base year for every 2025 comparison, and the year borrowings peaked at IDR3.2 trillion and LTV at 3.0%. · Open →
PT Saratoga Investama Sedaya Tbk — FY2023 Annual Report — FY2023 · 157 pages · The loss year: an IDR10.2 trillion mark-to-market loss shows what the same model does when investee prices fall. · Open →
PT Saratoga Investama Sedaya Tbk — FY2022 Annual Report — FY2022 · 162 pages · The commodity-peak year on the other side of 2023, useful for reading the portfolio through a full cycle. · Open →
Competitors describe PT Saratoga Investama Sedaya Tbk's market in their own filings and calls. These verified passages and visual pages show where their strategies meet, using source documents preserved in Sources.
PT Provident Investasi Bersama Tbk (PALM)
The closest listed analog to Saratoga in Indonesia and the one peer whose filings name Saratoga. PALM sits in the same IDX-IC G512 'Investment Companies' bucket, was built by the Provident founders who co-invested alongside Saratoga for two decades, and holds positions in the same asset families — Merdeka Copper Gold, Merdeka Battery Materials, and, until 2025, logistics and telecom. Its FY2024 register also carried PT Saratoga Sentra Business as a >5% shareholder of PALM itself, and until 17 March 2025 the two shared people as well as assets — PALM's Investment Committee included Michael W. P. Soeryadjaya, disclosed there as President Director of Saratoga since 2015. Read as the mirror of Saratoga's own mandate written by someone chasing the same assets.
PALM's own statement of its investment mandate, from the company-history section of the FY2025 annual report. The sector list — natural resources, technology, media, telecommunications, logistics — overlaps Saratoga's stated pillars almost item for item, and the selection criteria (attractive valuations, growth prospects, solid business models) are the same generic screen. What the passage also dates is how recent the rivalry is: PALM only became an investment company in August 2022, after selling out of palm oil. It is a mandate statement, not evidence of execution.
The Company's transformation continued following the divestment of all plantation-related Subsidiaries, with a new focus as an investment company. This change was accompanied by a name change to PT Provident Investasi Bersama Tbk, effective as of August 23, 2022 pursuant to Deed No. 122/2022 as stated in the Company Profile section of the Annual Report. In carrying out its role, the Company directs investments toward Indonesian companies with attractive valuations, strong growth prospects, and solid business models, particularly in national priority sectors such as natural resources, technology, media, telecommunications, and logistics, while maintaining discipline in risk management and investment.
p. 41 · Read in context →
PALM's supervisory board describing the 2025 rotation: out of logistics and telecommunications, deeper into natural resources, including a first-ever investment in a private (unlisted) gold vehicle in North Sumatra. Two things matter for the comparison with Saratoga. First, the direction of travel — concentrating rather than diversifying, and into gold specifically. Second, the move into a private company, which is where Saratoga has historically claimed an edge. 'Optimal returns' is the board's characterisation; the underlying transactions are itemised on p.52 of the same report.
Hardi Wijaya Liong (President Commissioner) — Report of the Board of Commissioners: During the reporting year, the Board of Directors undertook strategic actions through divestments in the logistics and telecommunications sectors generating optimal returns, while strengthening investment focus through new initiatives in the natural resources sector. The Company, for the first time, made an investment in Aurum, a private entity with strategic ownership in gold exploration and development projects in North Sumatra. […] The Board of Commissioners concurs with the Board of Directors' strategic approach in positioning the Company's investments in the natural resources sector as a key pillar.
p. 21 · Read in context →
The one place in the peer set where Saratoga appears by name in a competitor's filing. PALM's FY2024 portfolio review of Merdeka Copper Gold lists Saratoga first among MDKA's prominent shareholders, alongside PALM's own holding vehicle PT SAM and PALM's controlling shareholder PT Provident Capital Indonesia. It documents that on Saratoga's single largest listed position the relationship is co-ownership rather than rivalry — the same cap table, entered at different times. PALM's FY2025 report drops the shareholder sentence and describes MDKA without naming its owners.
PT Merdeka Copper Gold Tbk (“MDKA”) is a holding company that oversees various companies in the mining sector, including the production and exploration of gold, silver, nickel, and other minerals. Established in 2012, MDKA became a public company in 2015 with the share code MDKA. MDKA's Shareholders include several prominent Shareholders, such as PT Saratoga Investama Sedaya Tbk, PT PCI (via PT Mitra Daya Mustika), the Company (via PT SAM), and Mr. Garibaldi Thohir.
p. 41 · Read in context →
PT Indika Energy Tbk (INDY)
The Indonesian holding company redeploying coal cash flow into the same energy-transition and minerals assets Saratoga targets — gold, nickel, logistics infrastructure, EV, solar — and the peer that discloses hard capital-allocation numbers for the pivot. Indika is also the clearest read on how long a portfolio rotation of this kind actually takes: its own reports document the non-coal revenue target slipping by three years. Only the investment-holding and diversification discussion is used here; the Kideco mining and energy-services operations are outside the comparison.
Indika's statement of where it intends to put capital. The sector list — minerals, logistics and infrastructure, EV, nature-based solutions, solar, battery storage — is the same hunting ground Saratoga describes as energy transition, infrastructure and digital infrastructure. The Awak Mas figures are the operational anchor: a gold project 47.6% built at the end of 2025 with US$100.1m spent, targeting trial production end-2026. The 50%-by-2028 revenue split is a company target, not a result; the achieved mix is on p.312 of the same report.
Our transition is focused and disciplined—to achieve at least 50% of revenue from non-coal businesses by 2028 while strengthening portfolio resilience. Through Diversification, Decarbonization, and Divestment, we are accelerating toward a lower-carbon future, unlocking new growth and supporting Indonesia's energy security and climate goals as well as achieving its net-zero emissions target by 2050. We are expanding our portfolio by investing in low-carbon and high-growth sectors, including minerals, logistics & infrastructure, electric vehicles, nature-based solutions, solar energy, and battery storage. This supports the development of a more balanced, resilient, and future-oriented business. […] The Awak Mas gold project is currently in the construction phase, with trial production targeted for the end of 2026. As of the end of 2025, construction progress had reached 47.60%, with capital expenditure absorption amounting to US$100.1 million.
p. 26 · Read in context →
The two numbers side by side in Indika's operational review: 95.4% of 2025 capex went to non-coal businesses, yet non-coal was still only 18.0% of revenue, up 2.1 points on the year. This is the arithmetic of a listed Indonesian holding company rotating a portfolio in public — near-total redirection of new capital producing incremental movement in the revenue mix — and it is the closest disclosed benchmark for how quickly a peer's asset base can actually turn over. Revenue mix, not NAV mix; Indika consolidates its coal operations, so the denominator is operating revenue rather than portfolio value.
Of the total capital expenditure of US$139.0 million during 2025, the Company allocated US$132.6 million, or more than 95.4%, to the development of non-coal businesses. One of the key investment focuses is Awak Mas, a gold mining project in Luwu, South Sulawesi, which represents an important part of Indika's expansion into the minerals sector. […] As the transition is still ongoing, the coal business continues to serve as the main pillar of Indika Energy. In 2025, the coal business segment contributed 82.0% of the Company's revenue. Meanwhile, the proportion of non-coal business increased to 18.0%, up from 15.9% in 2024.
p. 312 · Read in context →
From the year-by-year transformation timeline printed at the front of the FY2025 report, which runs newest first — so the 2024 entry (the deferral) is quoted here ahead of the 2023 entry (the original target). Indika set a 50% non-coal revenue goal for 2025, then moved it to 2028. Management's own framing calls the original target 'highly ambitious' and the revision 'strategic adaptation'; the disclosure is unusually direct about a missed target, and it is the peer group's clearest evidence of the lag between announcing a portfolio pivot and delivering one.
As a form of strategic adaptation, the Company realistically adjusted its target of 50% non-coal revenue to 2028. […] In this phase, the Company set a highly ambitious target of achieving 50% of its revenue from non-coal sectors by 2025.
p. 5 · Read in context →
PT Astra International Tbk (ASII)
Indonesia's largest listed diversified group and the best-capitalised domestic bidder for the growth-stage minority stakes Saratoga pursues. Astra is a conglomerate, so only the capital-allocation and new-investment discussion in the FY2025 management reports is used here — the automotive, heavy-equipment and financial-services operations are outside the comparison. What the exhibits show is Astra explicitly targeting healthcare, industrial and logistics infrastructure and natural resources, and taking 20–31% minority positions in exactly the format Saratoga uses.
Astra's board naming its three target areas for new investment: healthcare, industrial and logistics infrastructure, and natural-resource ventures. That list is a near-complete overlap with Saratoga's stated pillars, and it comes from a balance sheet an order of magnitude larger — Rp507tn of total assets at end-2025. 'Significant headroom' is management's characterisation of the opportunity, not a sized market. The same page notes a Strategic Review still in progress, so the 2026 allocation is not yet fixed.
Djony Bunarto Tjondro (President Director) — Report of the Board of Directors: The Group will continue its strategic priorities: strengthening and optimizing its core business, developing businesses that are adjacent to its core business, and investing in new strategic area. The Board of Directors sees significant headroom in healthcare, industrial and logistics infrastructure and potential natural-resource ventures. Future growth will be financed pursuant to a disciplined capital management, strict performance monitoring and a focus on operational efficiency.
p. 51 · Read in context →
The concrete version of the strategy above, and the exhibit that most directly prices the competition for assets. Astra discloses Rp8.6tn committed to healthcare across a listed hospital operator (Hermina, 20.2%), a digital health platform (Halodoc, 31.3%) and a specialist hospital, built up over four years. These are non-controlling stakes in Indonesian growth companies — the same instrument and the same sector Saratoga has used — funded from a group that generated Rp40.2tn of profit in 2025. Astra does not disclose the entry valuations or the mark on these positions.
Djony Bunarto Tjondro (President Director) — Report of the Board of Directors: The Group increased its ownership in Halodoc to 31.3% and PT Medikaloka Hermina Tbk (Hermina) to 20.2%. As of the end of 2025, the Group's total investment in the healthcare sector, including Hermina, Halodoc and Heartology Hospital, amounts to Rp8.6 trillion. These transactions build on the Group's initial investments in Halodoc in 2021 and Hermina in 2022, reflecting a long-term commitment to developing a healthcare ecosystem.
p. 48 · Read in context →
Astra's six-year retrospective on how it invests, which separates two different activities that a diversified group can run at once: adjacency deals inside its existing franchises (used cars, financing, digital banking) and 'selective investments' in genuinely new sectors, healthcare and mineral mines. Only the second category competes with Saratoga for assets. The distinction matters for judging how much of Astra's capacity is actually pointed at the same deals — the adjacency spending is core-business capex that would happen regardless.
Djony Bunarto Tjondro (President Director) — Report of the Board of Directors: Throughout this period, Astra continued to pursue opportunities in strategic investments in sectors with strong long-term growth potential. The Group has expanded into adjacent areas naturally connected to its core capabilities, such as increasing its investments in used car segment and broadening product offerings beyond traditional automotive financing (e.g. multipurpose financing, digital banking). The Group has also pursued new growth opportunities through selective investments in sectors such as healthcare and mineral mines.
p. 45 · Read in context →
PT Indoritel Makmur Internasional Tbk (DNET)
Listed alongside Saratoga in the IDX 'Perusahaan Investasi' grouping and running the same structural model: a small holding company whose reported earnings are equity income from long-held non-controlling stakes in Indonesian consumer champions, valued by the market on portfolio value rather than operating profit. Its one consolidated asset, the fibre network FiberStar, puts it directly in Saratoga's digital-infrastructure pillar, and its disclosures give a rare like-for-like read on the operating scale behind an Indonesian holdco's digital-infrastructure position.
DNET's entire portfolio in one sentence: one consolidated fibre subsidiary plus three associate stakes in Indonesian consumer businesses — the Indomaret convenience chain, KFC Indonesia and Sari Roti. It is the structural template Saratoga uses — a handful of concentrated, long-held minority positions in domestic champions — applied to consumer rather than resources and infrastructure. The disclosure gives no ownership percentages or carrying values; those sit in the financial statements.
Currently, the Company's core business focuses on investments through its ownership in the subsidiary PT Mega Akses Persada (“FiberStar”), supported by the performance of three associates, PT Indomarco Prismatama (“Indomaret”), PT Fast Food Indonesia Tbk (“FAST”), and PT Nippon Indosari Corpindo Tbk (“ROTI”).
p. 9 · Read in context →
The operating scale behind DNET's digital-infrastructure position: 483,455 customers, 63,758 km of fibre, 17 provinces, and subsea capacity reaching Singapore. This is the asset a rival Indonesian holding company has built in the same infrastructure category Saratoga lists among its pillars, and the customer and route-kilometre counts are the concrete yardstick for comparison. All figures are FiberStar's own disclosures via its parent; the 'national resilience' framing is the company's.
As of 2025, FiberStar has served 483,455 customers, supported by a fiber optic cable network spanning 63,758 km, delivering high-speed internet services with strong reliability. Currently, FiberStar services cover 17 provinces, including undersea cable networks connecting 145 cities/districts in Sumatra, Java, Bali, Kalimantan, and Sulawesi to Singapore. This terrestrial and submarine infrastructure is expected to strengthen national resilience, particularly in the development of Indonesia's digital economy.
p. 78 · Read in context →
DNET stating the analytical problem that all listed Indonesian holding companies share, Saratoga included: reported earnings are an accounting composite of one consolidated subsidiary and equity-method income from associates, so headline profit tracks the operating performance of whichever asset is consolidated rather than the value of the portfolio. Useful as the peer-set articulation of why these companies are read on portfolio value rather than reported earnings — DNET does not itself publish a net asset value.
As an investment company, the Company's financial performance is highly dependent on the performance of FiberStar as its subsidiary, which contributes revenue from customer contracts, as well as the performance of its three associates, which contribute to the Company's share of profit from associates and joint ventures. Accordingly, the achievement of the Company's financial performance is closely correlated with the operational performance of FiberStar.
p. 102 · Read in context →
PT Multipolar Tbk (MLPL)
The Lippo group's listed investment holding vehicle, competing for the same pool of investors who allocate to Indonesian holdco equity and, on the technology side, for the same growth-stage digital assets. Included mainly as a contrast case: MLPL states the same disciplined-capital-allocation doctrine as its larger peers while operating at roughly a twentieth of Astra's asset base and reporting a loss for 2025 — a reminder that the listed-holdco format in Indonesia spans very different underwriting outcomes.
MLPL's investment criteria followed immediately by its 2025 result, in the company's own sequence. The stated focus — healthtech, data and AI platforms, cloud, digital retail integration — is where MLPL says new money goes. The financial paragraph sets the scale: Rp15.1tn of assets, Rp6.3tn of equity, gearing of 0.3x, and a loss attributable to owners of Rp156.4bn. The 'remain solid' and 'solid operational performance' framing is management's; the loss line is disclosed in the same breath, so the exhibit carries both.
Adrian Suherman (President Director) — Report from the President Director: Furthermore, the Board of Directors directs the investment and divestment process based on an assessment of business feasibility, growth potential, and contribution to the overall portfolio strategy. The focus is on high-value initiatives such as healthcare technology, data and AI platforms, cloud solutions, and digital integration opportunities in the retail and consumer services industries. […] On a consolidated basis, the Company's financial fundamentals remain solid. Total assets increased to Rp15.1 trillion or increased 14.9%, driven by growth in current assets and optimization of the investment portfolio. Total equity also increased 29.5% to Rp6.3 trillion, reflecting its commitment to a sound financial foundation. Financial discipline is evident in the Debt-to-Equity Ratio of 0.3x and consolidated bank loans, which were successfully reduced to Rp2.0 trillion by year-end. Operational performance improved, with consolidated Net Sales growing 1.3% to Rp11.5 trillion. The Company also recorded gross profit of Rp1.9 trillion, reflecting solid operational performance, while loss attributable to owners of the parent entity amounted to Rp156.4 billion.
p. 31 · Read in context →
MLPL's claim to regional standing, from the corporate-history section: a repositioning in 2021 as 'a leading technology investment company in Southeast Asia' with a mandate to back local and regional startups. It is an unquantified self-assessment — no portfolio value, deal count or ranking is attached — but it marks where MLPL says it wants to compete, and the early-stage regional tilt is the one place in this peer set that differs from Saratoga's later-stage domestic approach.
At the end of 2021, the Company transformed into MPC to enhance its commitment to supporting and accelerating digital economic growth in Indonesia, thereby solidifying its position as a leading technology investment company in Southeast Asia. This transformation emphasizes the commitment to embrace more local and regional startups, in line with the vision to become a leading investment company and contribute positively to society.
p. 41 · Read in context →
More peer documents
PT Indika Energy Tbk — FY2024 Annual Report — FY2024 · 616 pages · The prior-year baseline for the non-coal mix (15.9%) and the earlier framing of the same five business pillars — useful for testing whether the 2025 language marks a real change of pace or a restatement. · Open →
PT Astra International Tbk — FY2024 Annual Report — FY2024 · 532 pages · The prior-year management reports, for dating when healthcare and mineral mines first entered Astra's stated priority list and at what carrying value the Halodoc and Hermina stakes stood before the 2025 top-ups. · Open →
Source: S&P Capital IQ consensus via Xpressfeed · Generated 2026-07-28.
Coverage caution: one analyst stands behind every forward line
Every metric that reports an analyst count shows n=1, and every high-low range is zero-width with a standard deviation of 0. Only six metrics are covered — EPS, normalized net income, EBITDA, EBIT, ROE and DPS — with no revenue, FCF, capex, net debt or cash-flow estimates and no quarterly periods. Read this as one broker's model rather than a consensus.
FY27 EPS consensus jumped from IDR 36.30 to IDR 194.53 between the 90-day and 30-day marks
Currency: IDR · Scale: money in billions, absolute · Point-in-time consensus; Δ90d is Now versus 90d.
| Metric | FY | 180d | 90d | 30d | Now | Δ90d |
|---|---|---|---|---|---|---|
| EPS (normalized) | FY2027 | IDR 36.30 | IDR 36.30 | IDR 194.5 | IDR 194.5 | +435.9% |
| EPS (normalized) | FY2028 | — | — | IDR 205.0 | IDR 205.0 | — |
FY2025 normalized EPS printed at 538 against the 66.31 estimate on file
The same year's EBITDA actual of 6,788.809 sits against a consensus of -256.103. There is no quarterly beat/miss record for Saratoga, so this single annual pairing is the only calibration available for how closely the modelled framework tracks reported results.
Net income, EPS and ROE all rise through FY28 while EBIT and EBITDA stay negative every year
Normalized net income runs 2,008.03 then 2,634.08 then 2,775.04 across the three years, so the growth rate falls off sharply after FY2027. Dividend per share is the one non-monotonic line, at IDR 103.50 in FY2026, IDR 77.39 in FY2027 and IDR 91.58 in FY2028.
Currency: IDR · Scale: money in billions, absolute · YoY uses the prior fiscal year from the feed; analyst count and range use the first displayed period.
| Metric | FY2026E | FY2027E | FY2028E | YoY | Analysts | Low / high |
|---|---|---|---|---|---|---|
| EPS (normalized) | IDR 148.3 | IDR 194.5 | IDR 205.0 | -72.4% | 1 | IDR 148.3 / IDR 148.3 |
| Net income (normalized) | IDR 2,008 | IDR 2,634 | IDR 2,775 | +123.6% | — | — |
| EBITDA | -IDR 251.9 | -IDR 274.3 | -IDR 298.9 | -103.7% | 1 | -IDR 251.9 / -IDR 251.9 |
| EBIT | -IDR 255.5 | -IDR 278.0 | -IDR 302.6 | +0.7% | — | — |
| ROE | 3.4% | 4.4% | 4.5% | +1.7pt | — | — |
| Dividend per share | IDR 103.5 | IDR 77.39 | IDR 91.58 | +229.2% | — | — |
A single target price of IDR 2,850, and both recommendations on file are buy or outperform
The consensus recommendation score is 1.5, from one buy and one outperform, with no holds, sells or no-opinion. Mean, median, high and low target are all IDR 2,850 because a single estimate underlies each of them.
Currency: IDR · Scale: money in billions, absolute · Analyst counts shown explicitly.
| Street view | Reading | Analysts |
|---|---|---|
| Recommendation mix | Buy 1, Outperform 1, Hold 0, Underperform 0, Sell 0 | 2 |
| Consensus score | 1.50 | 2 |
| Target price | mean IDR 2,850; median IDR 2,850; high IDR 2,850; low IDR 2,850 | 1 |
What Saratoga is
PT Saratoga Investama Sedaya is a Jakarta holding company that owns minority and controlling stakes in a concentrated set of Indonesian businesses and reports its own worth as the market value of those stakes less net debt. At the end of 2025 that figure was Rp60,284 billion, or Rp4,444 per share [1]. The shares closed at Rp1,760 on 27 July 2026 [2]. The distance between those two numbers is what this report is about.
Saratoga describes itself as an active investment company, founded in 1997 and listed on the Indonesia Stock Exchange under the code SRTG [3]. It came to market on 26 June 2013 at Rp5,500 a share, split the stock five-for-one in May 2021, and has had 13,564,835,000 shares outstanding since [4]. That IPO price is Rp1,100 in today's shares, so thirteen years of listed life have produced a 60% price gain plus modest dividends. It employs 67 people [5]. There is no operating business at the holding company: it buys stakes, sits on boards, collects dividends and occasionally sells. Its own annual report says plainly that marketing is a matter for the investee companies, not the parent [6].
The company publishes its net asset value on a fixed arithmetic each year: the sum of investee company values, minus debt, plus cash [7]. For 2025 that was Rp60,768 billion of investee value, less Rp1,451 billion of debt, plus Rp967 billion of cash, giving Rp60,284 billion — up 12% on 2024's Rp53,985 billion [8].
NAV per Share, 31 Dec 2025 (Rp)
Share Price, 27 Jul 2026 (Rp)
Discount to Last Published NAV
Market Cap (Rp billion)
Sources: NAV per share from the FY2025 Annual Report NAV bridge [9]; closing price of Rp1,760 on 27 July 2026 [10]; market cap and discount derived from that price and the 13,564,835,000 shares outstanding [11].
What it owns
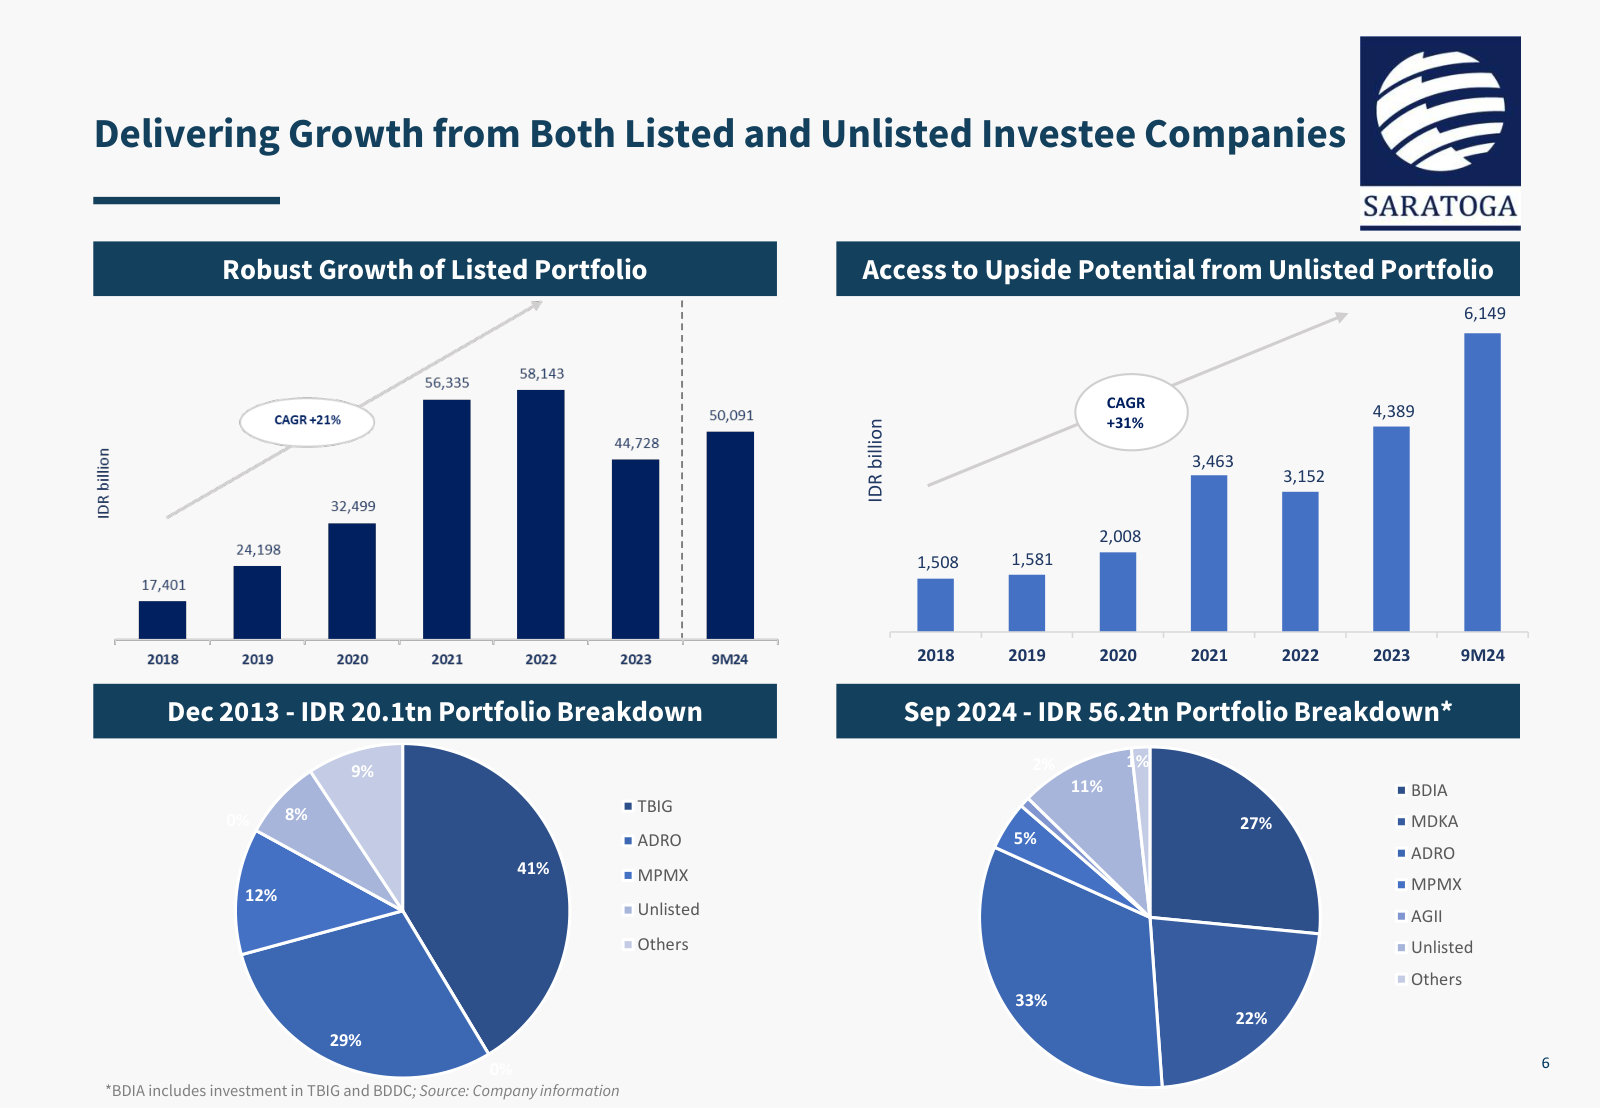
Four listed holdings account for three-quarters of the portfolio. Tower Bersama, a telecom tower operator with more than 24,300 sites, is the largest position at 30.7% of portfolio value [12]. Merdeka Copper Gold is a gold, copper and nickel producer; Alamtri Resources and Adaro Andalan are the two halves of the former Adaro coal group, separated in late 2024 into a minerals-and-renewables company and a standalone thermal coal producer [13].
Source: FY2025 Annual Report, Net Asset Valuation as of 31 December 2025 and 2024; portfolio shares derived from the same table [14].
Two things about that table matter for everything downstream. The first is concentration: TBIG, MDKA, ADRO and AADI together are Rp46,484 billion, or 76.5% of investee value. The second is what sits underneath the four names — towers, gold and copper, metallurgical coal and minerals, thermal coal. Roughly 46% of the portfolio is priced off commodities, and coal in particular still funds much of the cash that reaches Jakarta.
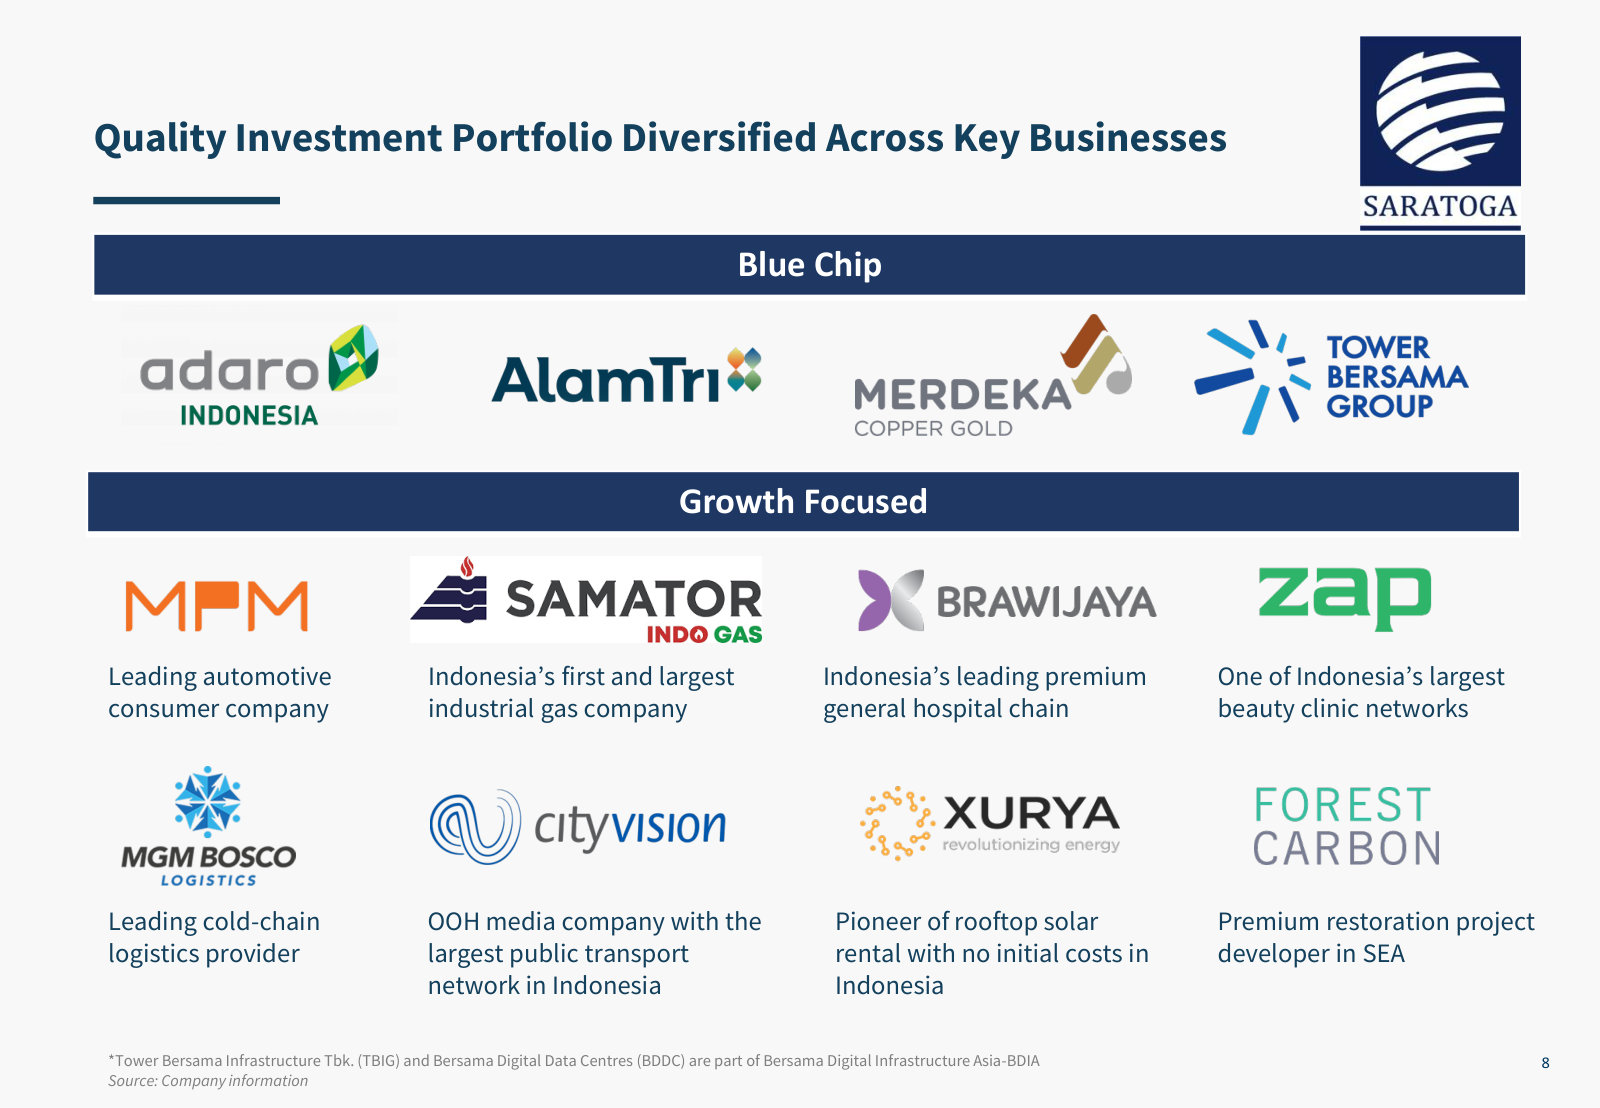
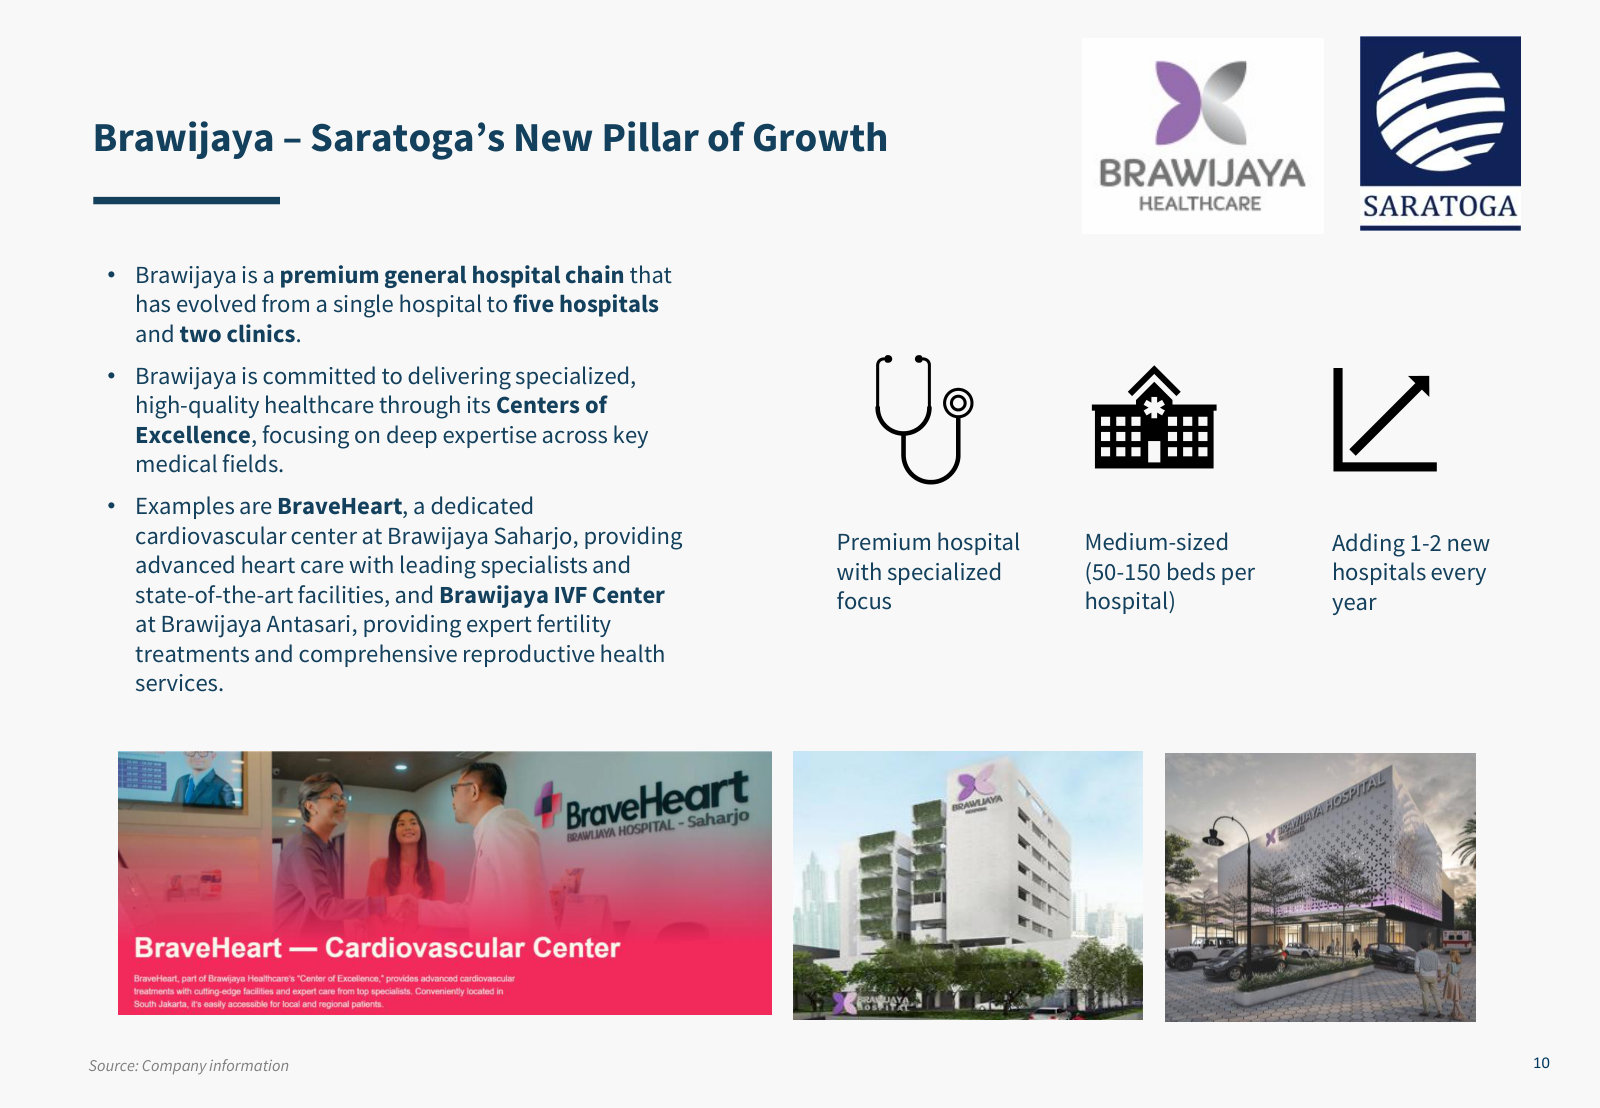
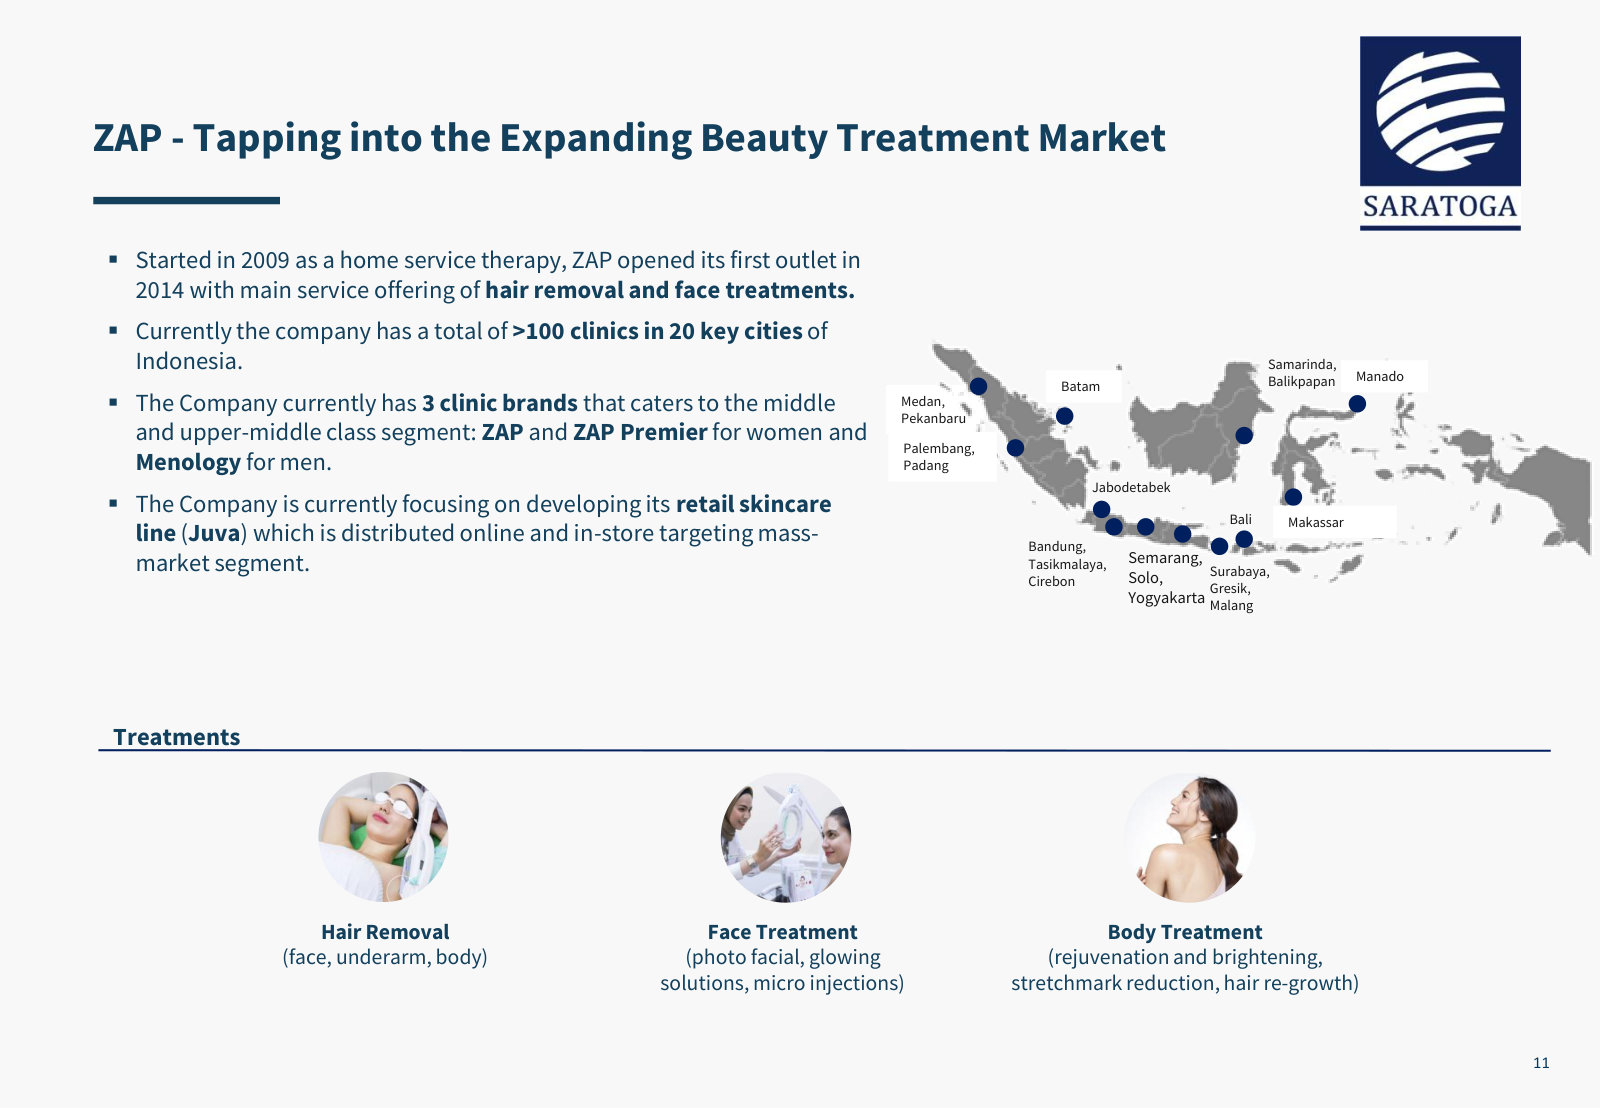
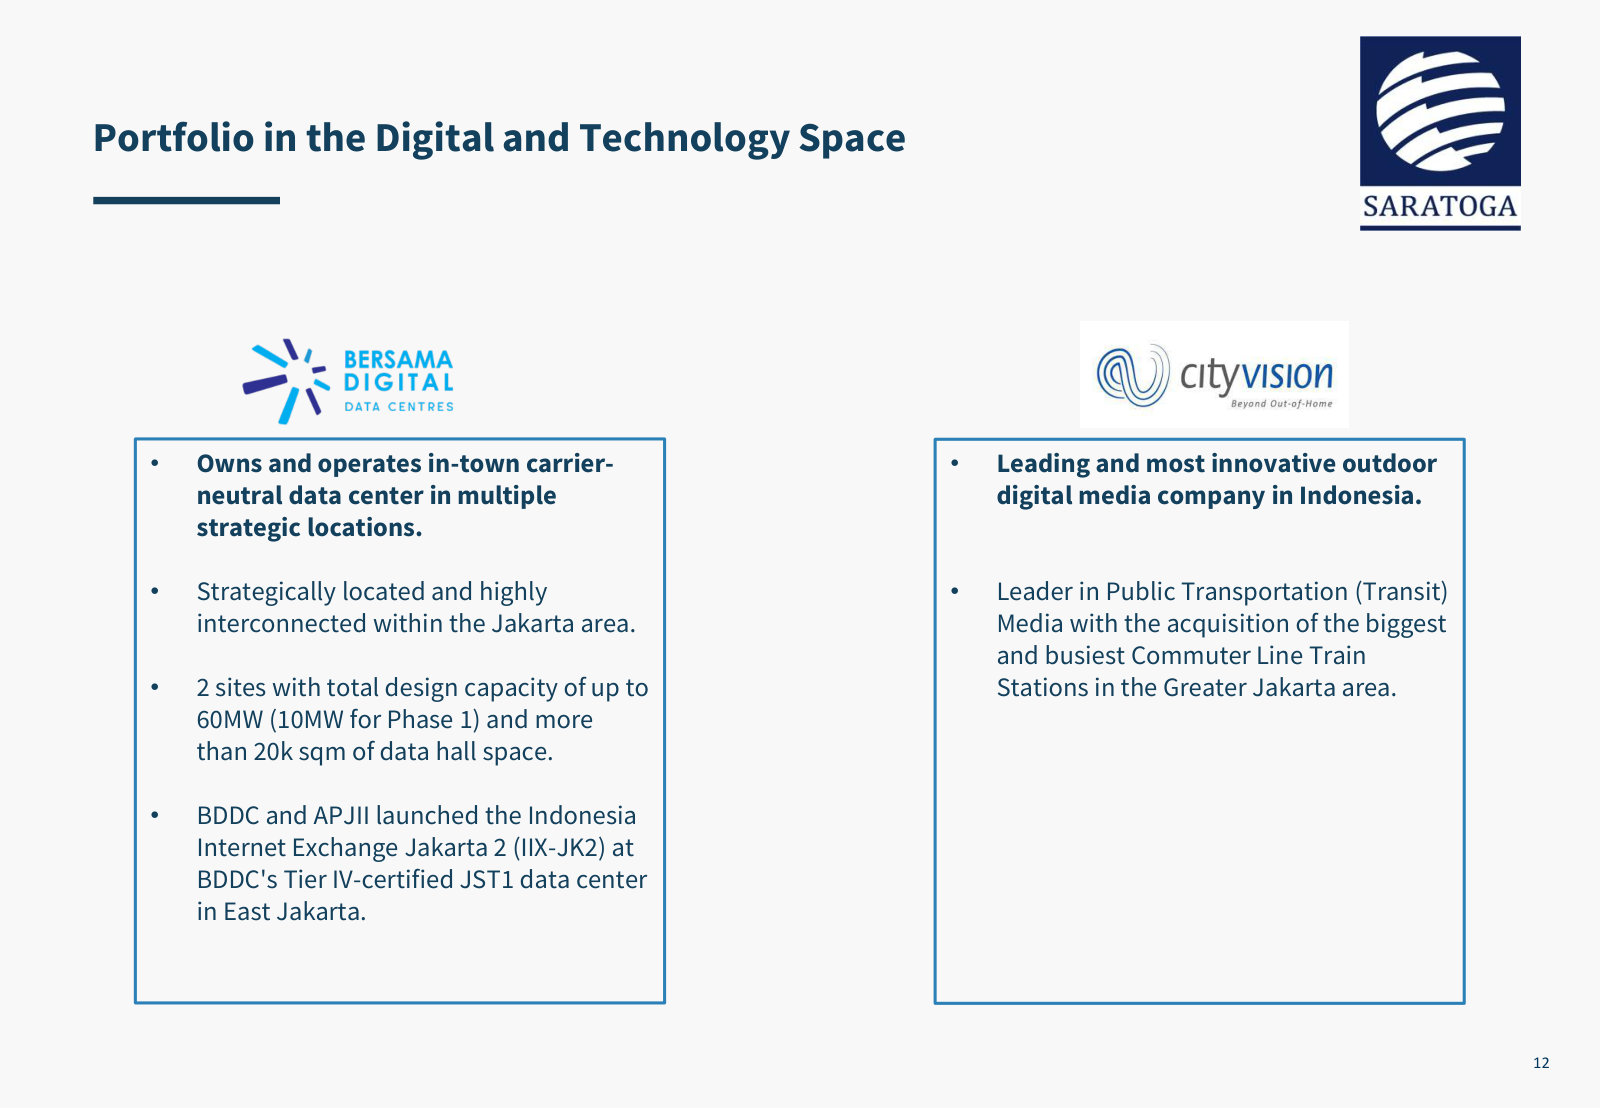
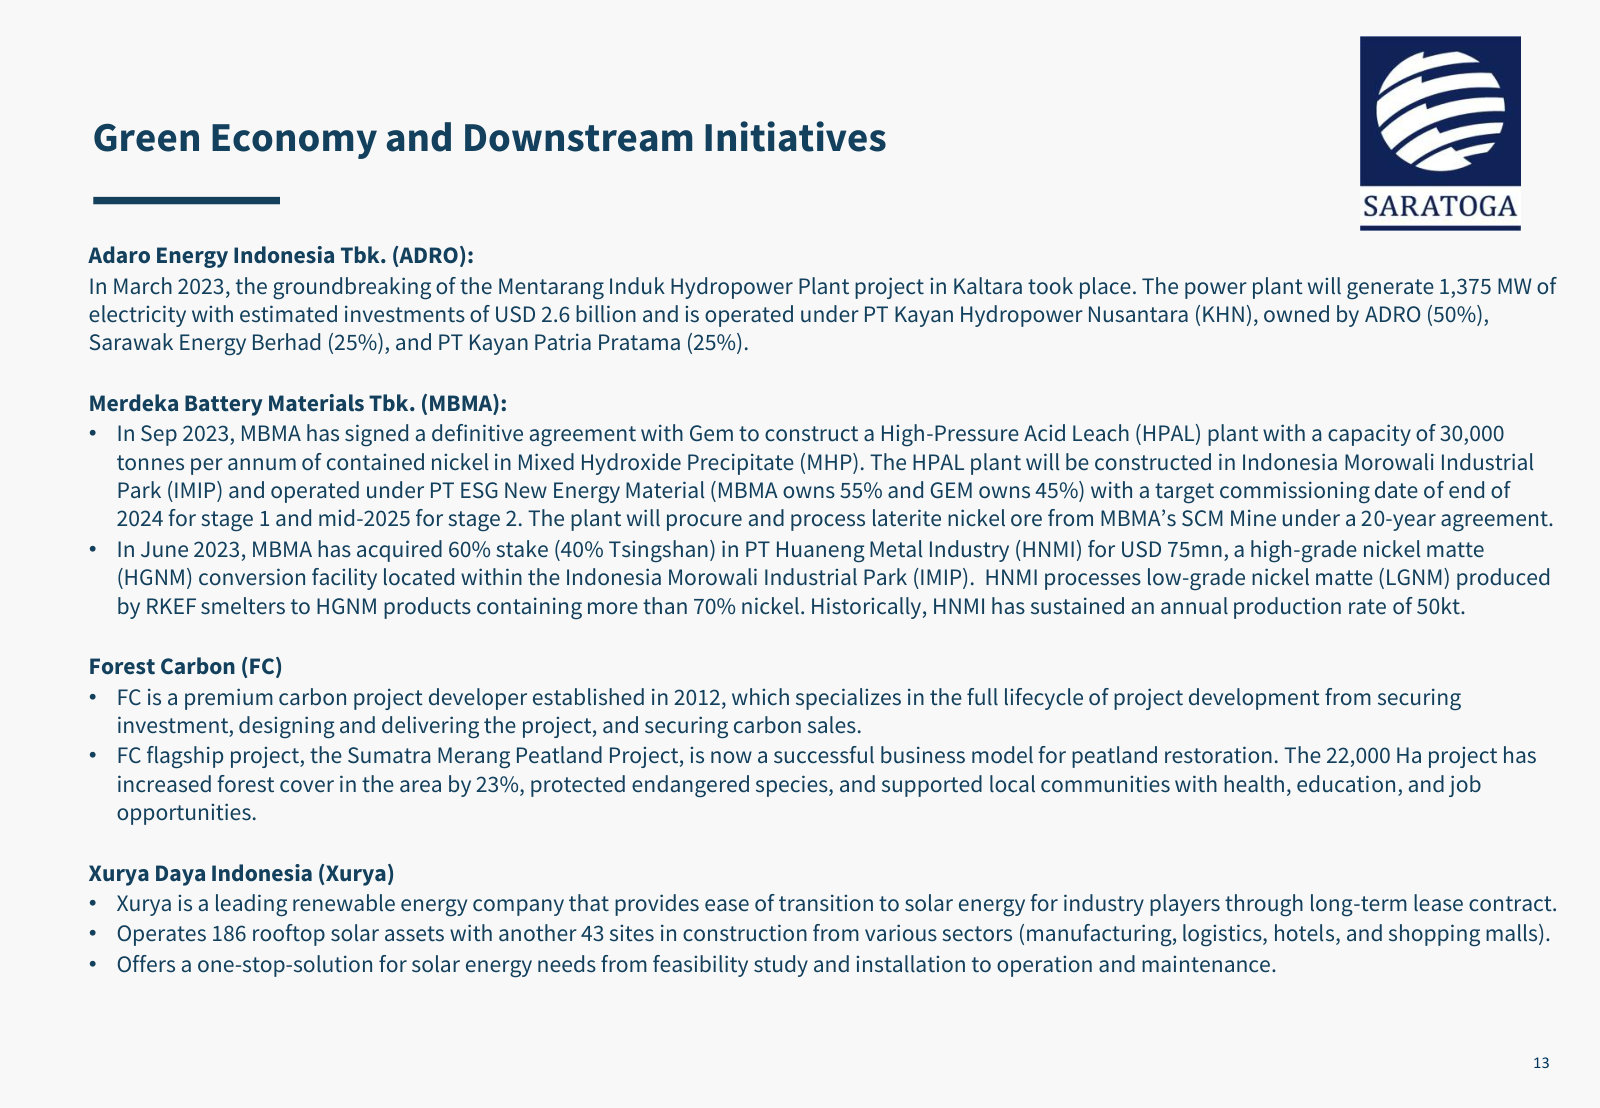
The rest is a mix of a majority-owned automotive group (Mitra Pinasthika Mustika, 57.7%), industrial gas, construction, and a set of private businesses the company has been scaling: Brawijaya Healthcare, six hospitals and a clinic, which opened Brawijaya Taman Mini in 2025 [15]; ZAP, 118 aesthetic clinics [16]; the solar developer Xurya [17]; and the data-centre platform Digital Realty Bersama [18].
Where the money comes from
Saratoga's income statement is two very different things stapled together, and a reader who treats reported profit as earnings will be misled.
Sources: FY2025 Annual Report, Consolidated Statements of Profit or Loss for 2025 and 2024 [19]; FY2023 Annual Report for 2023 and 2022 [20]; FY2022 Annual Report for 2021 [21].
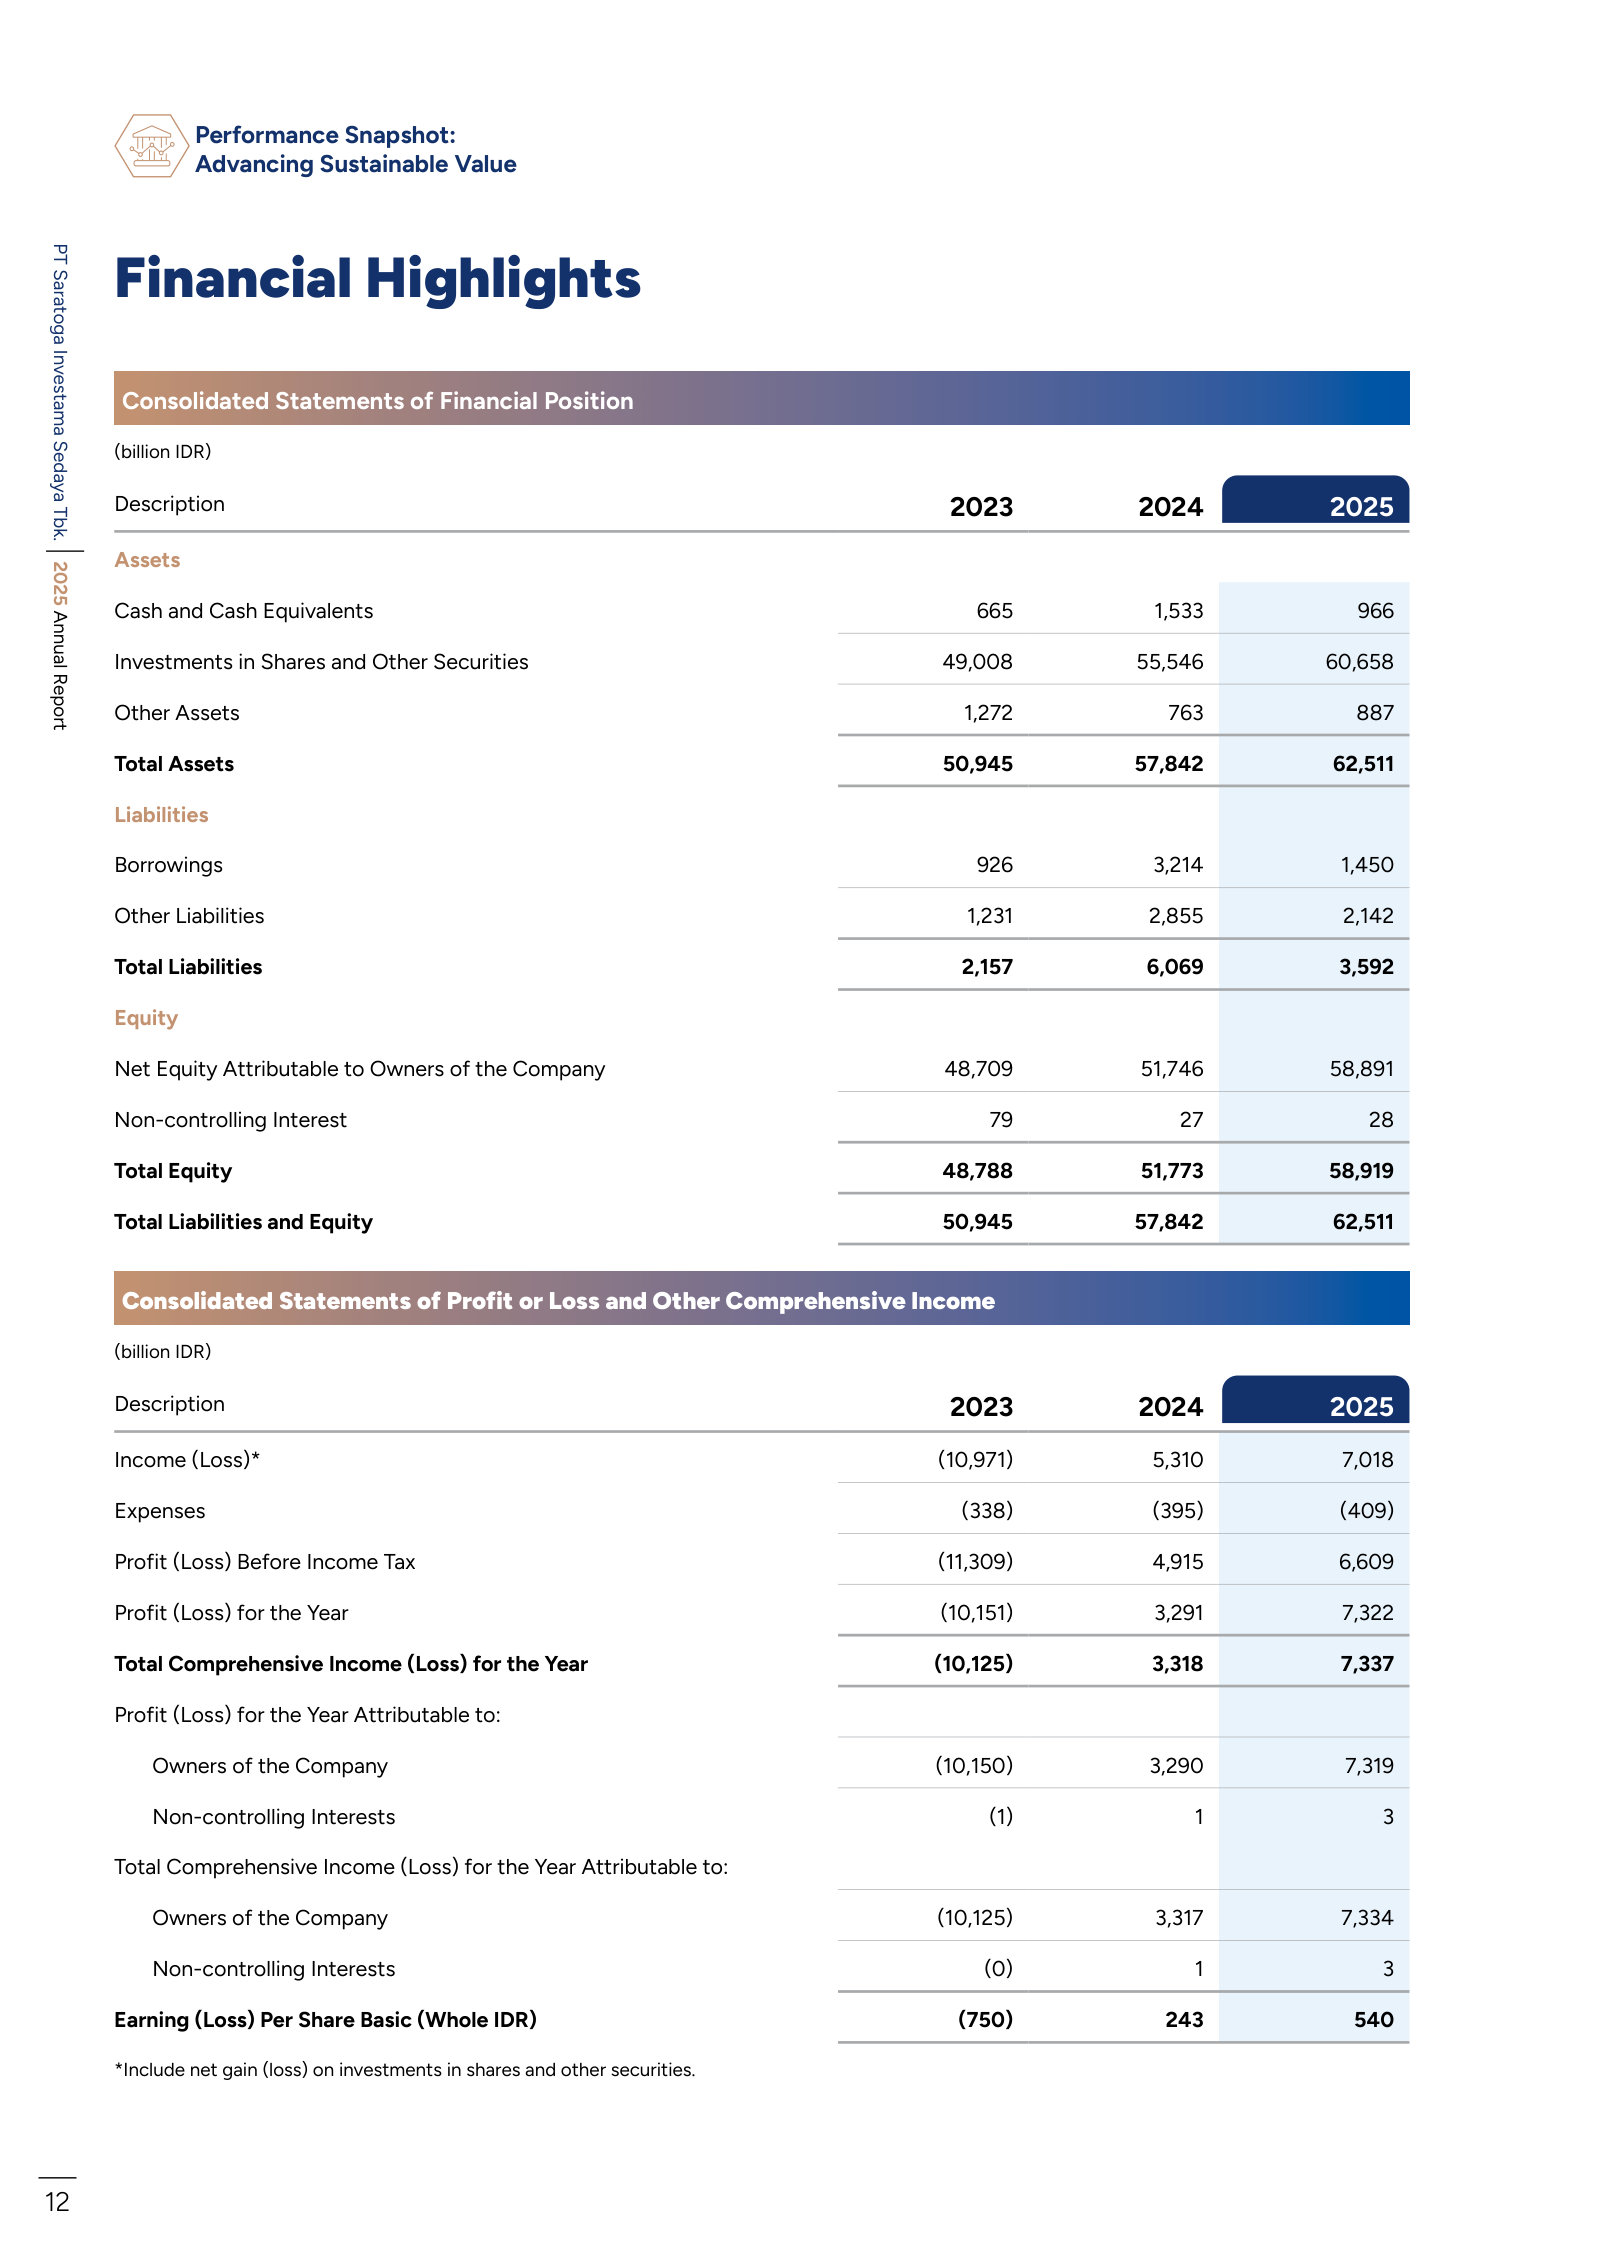
The blue bars are unrealised revaluation of the stakes. They swing from a Rp24,408 billion gain in 2021 to a Rp13,811 billion loss in 2023 and back to a Rp4,140 billion gain in 2025 [22][23]. They are a restatement of the same NAV that appears on the balance sheet, not income in any cash sense. Reported profit follows them: a Rp10,151 billion loss in 2023, a Rp3,291 billion profit in 2024, a Rp7,322 billion profit in 2025 [24]. Earnings per share ran from minus Rp750 to Rp243 to Rp540 over the same three years [25]. Any multiple built on those numbers is arithmetic performed on a price index.
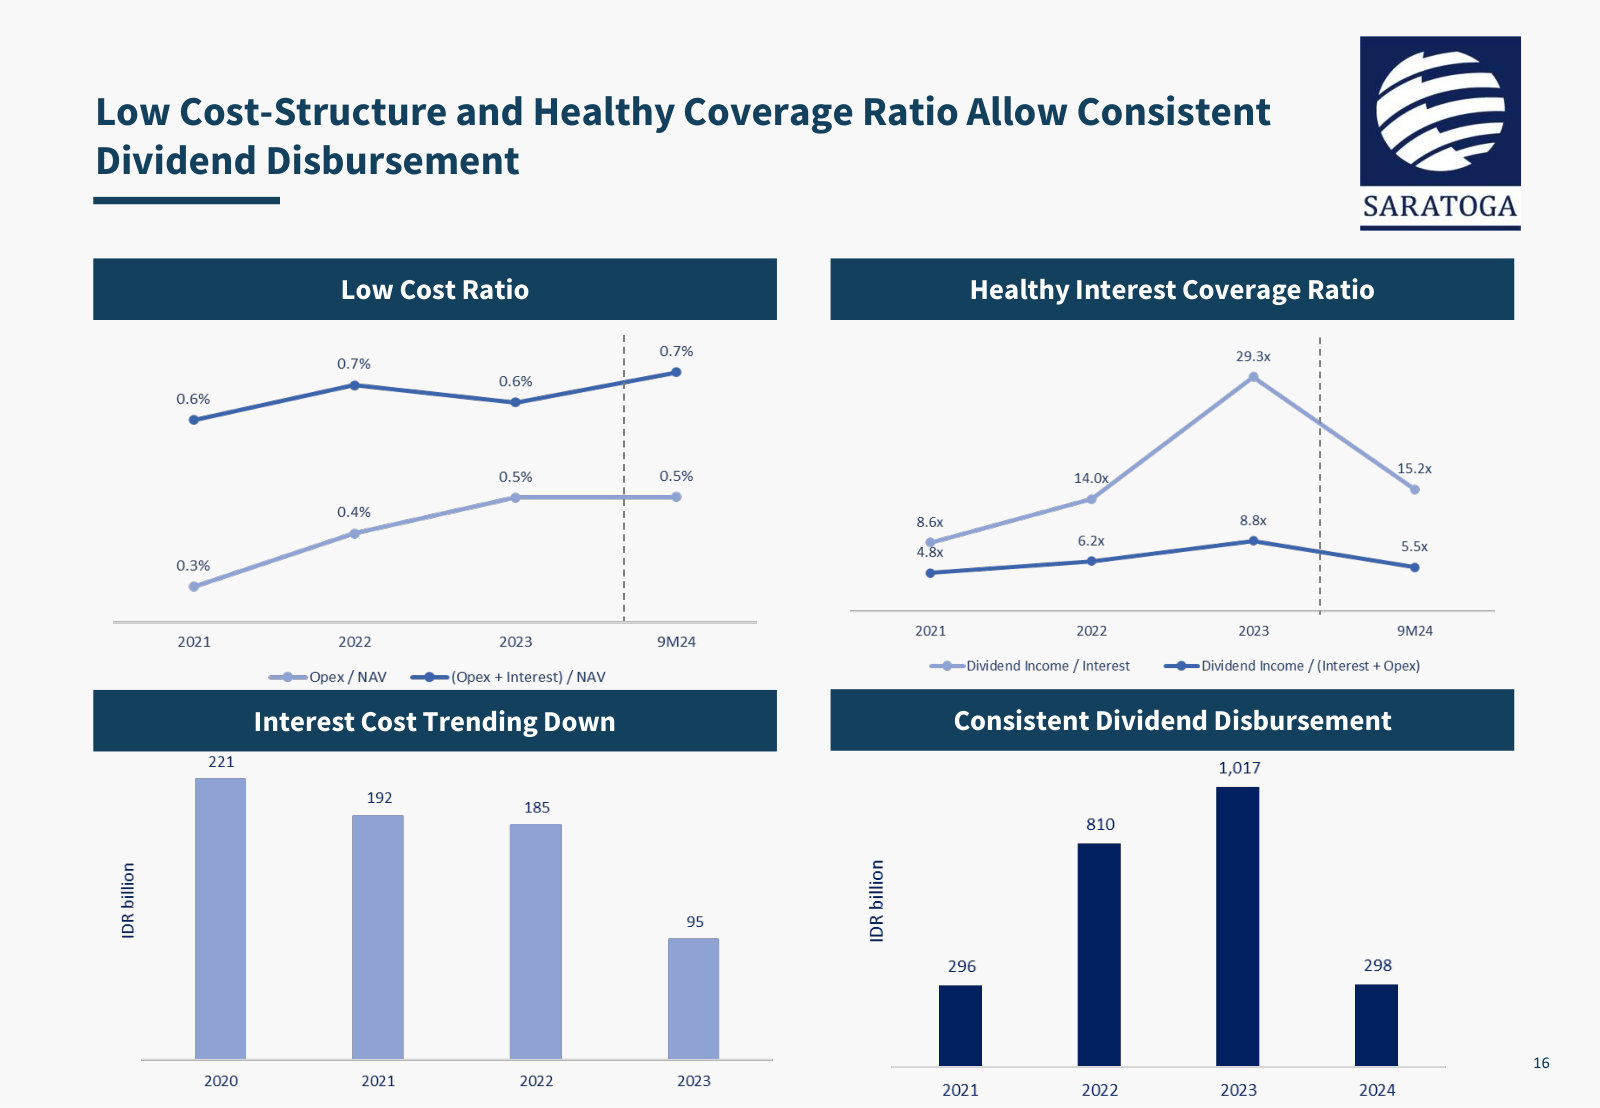
The orange bars are the cash business, and it is small, steady and legible. Dividend income was Rp2,784 billion in 2023, Rp3,786 billion in 2024 and Rp2,705 billion in 2025, of which ADRO and AADI supplied Rp2,149 billion in 2025, TBIG Rp225 billion and MPMX Rp304 billion [26]. Against that, the whole holding company costs Rp233 billion a year to run and Rp165 billion to finance [27]. Operating cost is 0.4% of NAV [28]. On a fee-comparison basis that is cheap for a managed pool of assets, and the cost line has barely moved in three years while NAV rose 23%.
The dependence on coal dividends is the obvious fragility. In 2025 the two Adaro entities were 79% of dividends received, and dividend income fell 29% year on year as thermal coal prices normalised, even as NAV rose 12% [29].
What shareholders have received
For three years Saratoga kept almost all of the cash it collected. That changed with the 2025 distribution.
Sources: dividends income by investee, FY2025 Annual Report [30]; distributions for FY2023 and FY2024, FY2025 Annual Report dividend table [31]; FY2025 distribution derived from the Rp103.3 per share reported paid on 12 June 2026 and shares outstanding [32].
The distributions for FY2023 and FY2024 were Rp22 and Rp14.75 a share, Rp297.8 billion and Rp199.9 billion in total — 11% and 5% of the dividends the company itself had received [33]. For FY2025 the board deferred the amount to the general meeting of 18 May 2026 [34], and Indonesian financial press reported a payment of Rp103.3 per share on 12 June 2026 [35]. That is roughly Rp1,401 billion, seven times the prior year and about half the dividends received. At Rp1,760 it is a 5.9% yield. The corpus contains no company document stating the FY2025 per-share amount, so that figure rests on press reporting rather than a filing — worth confirming against the eventual FY2026 annual report.
Price against value
The company's NAV per share has been roughly flat for three years while the share price has not.
Sources: NAV per share from each year's Net Asset Valuation table — FY2022 Annual Report for 2021 and 2022 [36], FY2023 Annual Report for 2023 [37], FY2024 Annual Report for 2024 [38], FY2025 Annual Report for 2025 [39]; year-end closing prices from the FY2022 Annual Report [40], FY2023 Annual Report [41] and the FY2025 Annual Report quarterly closing price table [42].
NAV per share was Rp4,492 at the end of 2022 and Rp4,444 at the end of 2025 — down 1% across three years, having fallen 20% in 2023 and recovered since [43][44]. The share price over the same window went from Rp2,530 to Rp1,580, and the intraday high of Rp3,850 set in the second quarter of 2022 is 54% above the July 2026 price [45][46]. The discount to published NAV widened from 33% at the end of 2021 to 64% at the end of 2025, with a partial narrowing in 2024.
At Rp1,760 the market values the whole company at about Rp23.9 trillion. The TBIG and MDKA stakes alone were marked at Rp29,469 billion on 31 December 2025 [47]. On those marks the market capitalisation is 19% below the value of two holdings; the coverage ladder that ranks each remaining stake against the market capitalisation is in Discount Arithmetic. The comparison mixes a July 2026 price with December 2025 marks, and the underlying stakes have moved since — the first-quarter 2026 statement shows investments in shares up 12% to Rp63,326 billion [48]. Applying the company's own NAV arithmetic to that statement gives roughly Rp67.8 trillion, near Rp5,000 a share, and a discount closer to 65%.
Who owns it
Three parties hold 89% of the shares. Edwin Soeryadjaya, the president commissioner and co-founder, held 35.87% directly at the end of 2025; PT Unitras Pertama held 31.62%; Sandiaga Salahuddin Uno, the other co-founder, held 21.51%. The public float — every holder below 5%, some 22,383 of them — is 10.995% [49]. The three executive directors hold a further 0.15% between them, and each added shares during 2025 [50]; all three bought again on 1 July 2026 at Rp1,560 under the long-term incentive programme [51].
Concentration of that degree cuts both ways and the report should hold both edges. Owners with 89% of the equity bear the discount alongside the minority, which is the strongest structural argument that management's incentives point at NAV per share rather than at size. The same 89% leaves an 11% float in a market where average daily volume ran at 6 to 13 million shares a quarter through 2025 [52] — roughly Rp10 billion to Rp20 billion a day at current prices. An institution cannot build a position of any size, and the discount is partly the price of that fact. Coverage is correspondingly thin: two brokers, one published earnings estimate, and no revenue consensus at all [53]. The company holds no earnings calls; the corpus contains no transcript for any period, because none exists.
How solid the balance sheet is
For an investor whose first question about a leveraged-looking holding company is whether it can go bankrupt, the answer here is unusually clean. Borrowings were Rp1,450 billion at the end of 2025 against Rp966 billion of cash, giving net debt of Rp484 billion and a loan-to-value ratio of 0.8%, down from 3.0% a year earlier [54]. Total liabilities of Rp3,592 billion sit against Rp62,511 billion of assets, and Rp2,054 billion of those liabilities are deferred tax rather than anything payable to a lender [55][56]. The loan maturity ladder runs Rp251 billion in 2026 and Rp763 billion as late as 2029, against annual dividend receipts of Rp2.5 trillion to Rp4.2 trillion [57][58]. By the end of March 2026 borrowings had fallen further to Rp796 billion against Rp1,027 billion of cash and time deposits — a net cash position [59].
The financing risk in this structure is not the holding company's own leverage. It is whatever debt sits inside the investees, which does not appear on this balance sheet at all — a question the report should take up separately.
How much of the NAV is checkable
About Rp51.6 trillion of the Rp60.8 trillion portfolio — roughly 85% — traces to listed quotes either directly or one level down, and about Rp9.1 trillion, some 15%, rests on discounted cash flow, comparable-company multiples or recent acquisition cost [60][61]. The published NAV also takes no deduction for the Rp2,054 billion deferred tax liability that would crystallise on realising the gains; charging it in full takes NAV per share from Rp4,444 to about Rp4,293 and the discount from 60% to 59% [62]. The fair-value hierarchy behind those marks, the auditor's key audit matter, and what the unpriced 15% is worth under haircuts are set out in Marks Without Prices.
What the report tests
Saratoga is a founder-controlled Indonesian holding company whose shares trade around 60% below the market value of the stakes it owns, and this report exists to establish whether that gap is a permanent feature of an 89%-held, commodity-weighted portfolio, or a discount that the company's own cash flows, disclosure and record of monetising assets can narrow.
The evidence assembled here points to a real asset base rather than an accounting one: 85% of the portfolio is anchored to observable listed prices, the holding company runs on 0.4% of NAV a year, net debt is effectively zero, and management owns 89% of what is being discounted. The strongest fact on the other side is that the discount has widened, not narrowed, in three of the last four years while all of those conditions already held. The deferred-tax charge and a discount for selling stakes of 15% to 32% close only a few points of that gap. What remains unexplained is not measurable from the filings: the 11% float, the 89%-held register, the coal concentration in the dividend stream, and the absence of a mechanism that converts NAV into cash for a minority holder are the candidates, and the chapters that follow take each in turn. The FY2025 distribution of roughly half of dividends received, if repeated, is the first evidence in three years of such a mechanism. A second year at that payout, or a large realisation returned to shareholders, would change the read; a reversion to a 5% payout would confirm the bearish one.
What this chapter does not settle
Forward estimates are outside what the filings support: two brokers cover the stock, one publishes an earnings number, and no revenue consensus exists [63]. For a company whose reported earnings are a mark-to-market artefact, a consensus EPS is close to meaningless in any case; the forward question is dividends and NAV growth, and it needs its own treatment. The debt and prospects of the investee companies, the quality of governance around related-party dealings, management's compensation, and the track record of actual exits — each is a chapter's worth of evidence, and none is settled by what is above.
The cash that actually arrives
Saratoga's reported earnings are almost entirely fair-value marks. The cash that reaches the holding company is dividends from investees, and in 2025 that stream, net of every holding-company cost, came to Rp2,294 billion — 9.6% of the Rp23,874 billion market capitalisation. Four-fifths of it came from two coal companies that together are 28% of the portfolio's value. This chapter separates the two flows and sets out what the single covering forecast says.
The audited cash flow statement is the cleanest window into the business. It shows six line items that recur every year — dividends collected, interest collected, interest paid, staff paid, tax paid, other operating payments — and two that are discretionary: proceeds from selling investments, and cash deployed into new ones. Stripping the discretionary items out gives a recurring cash result that ties exactly to the reported operating cash flow.
Source: audited consolidated statements of cash flows, years ended 31 December 2025 and 2024 [1]; subtotals derived.
Rp2,294 billion of recurring cash income in 2025 is Rp169 per share against the 27 July 2026 close of Rp1,760 — a 9.6% cash yield on the market price, and 3.8% on the Rp60,284 billion net asset value the company publishes [2]. On the 2024 base of Rp3,959 billion the same arithmetic gives Rp292 per share and 16.6%. The two years bracket the range, and the difference between them is the coal dividend: Alamtri paid Rp3,121 billion in 2024 and Rp1,515 billion in 2025 [3].
The holding company's own cost base barely moves. Staff payments ran Rp117 billion in 2024 and Rp118 billion in 2025 [4]; accrual operating expenses were Rp233 billion against an internal target of Rp267 billion, or 0.39% of net asset value [5]. Interest paid was Rp177 billion in 2025 and will fall: borrowings were Rp1,450 billion at year-end and Rp796 billion at 31 March 2026, against Rp871 billion of cash and Rp156 billion of time deposits [6].
Across five years the gross flows tell the same story with more amplitude.
Sources: FY2021 Annual Report, Consolidated Statements of Cash Flow [7]; FY2022 [8]; FY2023 [9]; FY2024 [10]; FY2025 [11].
2022 is the outlier that matters for calibration: Rp20,200 billion of disposal proceeds and Rp18,290 billion redeployed in the same year [12]. Much of that was a restructuring of the Tower Bersama holding, in which shares were sold to Bersama Digital Infrastructure Asia while a group company subscribed for Bersama Digital shares, taking effective ownership of Tower Bersama from 34.23% to 31.26% [13]. Gross proceeds at this company are not evidence of monetisation on their own; the redeployment line has to be read alongside them.
Reported profit and the marks behind it
The income statement runs on a different engine. Over five years the fair-value line swings from a Rp24,408 billion gain to a Rp13,811 billion loss and back to a Rp4,140 billion gain, while dividend and interest income never leaves a band of Rp1,656 billion to Rp3,849 billion.
Sources (Rp billion): FY2022 Annual Report, Review of Operations [14]; FY2023 [15]; FY2024 [16]; FY2025 [17].
The tax line moves with the marks too. Deferred tax was a Rp1,615 billion charge in 2024 and a Rp749 billion credit in 2025 [18], against cash income tax actually paid of Rp5 billion and Rp26 billion [19]. Three lines of the profit and loss account — the fair-value gain, the deferred tax, and therefore the bottom line — are opinions about prices rather than transactions.
The first quarter of 2026 is the cleanest single illustration. Reported profit was Rp5,321 billion, or Rp393 per share, on a Rp6,911 billion fair-value gain and a Rp1,500 billion deferred tax charge; dividend and interest income recognised in the quarter was Rp6 billion [20]. The cash statement for the same three months shows Rp705 billion of dividends actually collected and Rp97 billion deployed [21]; the related-party receivable fell from Rp731 billion to Rp27 billion over the quarter [22], a balance the company attributes largely to dividends receivable from Alamtri Resources [23]. Dividend income is recognised on declaration, and declarations cluster in the second and third quarters, so a single quarter's income statement says almost nothing about the year's cash.
Sources: profit from the Review of Operations tables, FY2022 and FY2025 Annual Reports [24], [25]; cash dividend receipts from the cash flow discussions [26], [27].
Where the value sits and where the income comes from
Alamtri and Adaro Andalan are 28.0% of Saratoga's Rp60,768 billion portfolio but supplied Rp2,149 billion, 79.4%, of the Rp2,705 billion of FY2025 dividend income out of which the roughly Rp1,401 billion FY2025 distribution was paid — and because every Rp100 of dividend per share is worth 3.43 percentage points of annual holder return at an unchanged price-to-net-asset ratio, about 2.8 of the 3.5 points that the Rp103.3 payout is worth traces to coal dividends, while Tower Bersama and Merdeka Copper Gold, 48% of the portfolio, supplied 8% and nothing respectively. [28] [29]
The dividend income breakdown is disclosed by investee every year.
Sources: dividend income breakdown tables, FY2022 Annual Report [30], FY2024 [31], FY2025 [32]; coal is Adaro Energy Indonesia, renamed Alamtri Resources Indonesia, plus Adaro Andalan Indonesia from 2025.
Coal's share of dividend income has been 67%, 74%, 77%, 82% and 79% in the five years to 2025 [33], [34], [35]. It has never been below two-thirds. The 2025 fall in total dividend income, from Rp3,786 billion to Rp2,705 billion, was Alamtri cutting from Rp3,121 billion to Rp1,515 billion, partly offset by Rp634 billion of first-time dividends from Adaro Andalan after the thermal coal separation [36].
The portfolio value at 31 December 2025 sits in a different set of names.
Source: derived from the net asset valuation table and the dividend income breakdown, FY2025 Annual Report [37], [38].
The discount is a claim on towers and copper; the yield is a claim on coal. One share certificate delivers both, but they are not the same asset and they will not decline or recover together.
That divergence also explains why the mark and the cash moved in opposite directions in 2025. Tower Bersama and Merdeka added Rp3,399 billion and Rp3,284 billion of fair-value gains while Alamtri and Adaro Andalan subtracted Rp4,600 billion [39] — net asset value per share rose 12% to Rp4,444 [40] in the same year cash dividend receipts fell 41% [41].
Debt first, dividend last
What Saratoga does with the cash has followed a consistent order of priority, and the dividend has come last in it. The record of distributions, by the year each was paid:
Sources: dividend tables, FY2022 Annual Report [42], FY2023 [43], FY2025 [44]; the 2026 amount from Indonesian press coverage of the May 2026 general meeting [45]. The 2021 payment of Rp110 per share is shown adjusted for the five-for-one split.
The Rp103.3 paid in June 2026 is the largest per-share amount in the company's listed history, but it is the second time in four years the company has distributed roughly Rp1 trillion: Rp1,017 billion, or Rp75 per share, went out in June 2023 [46]. What followed is the more instructive part: distributions fell to Rp298 billion and then Rp199.9 billion [47] across 2024 and 2025 — the two years in which the company deployed Rp5,772 billion into new investments [48] and drew Rp3,533 billion of bank loans to help fund it [49]. In 2025 the priority reversed: Rp4,686 billion of loans were repaid against Rp2,931 billion drawn and deployment halved [50], leaving borrowings at Rp1,450 billion and loan-to-value at 0.8% [51]. The large dividend arrived only once the balance sheet was clean.
There is no formula behind any of this, and the company says so. Its stated policy is that dividends require sufficient profit or positive retained earnings and are subject to the board's recommendation and shareholder approval, with no payout ratio specified [52]. The meeting that approved the 2026 payment framed it as 19.13% of FY2025 net profit of Rp7.32 trillion [53] — a percentage of a number that was itself 57% fair-value gain on investments [54]. The same ratio applied to the 2023 loss year would have produced nothing.
My read is that the dividend at Saratoga is a residual rather than a claim: it is what remains after management has decided how much to invest and how much debt to carry, and those two decisions come first. The strongest fact against that reading is the 2026 sequence itself — the payment was raised sevenfold in a year when dividend receipts fell 41%, which is a deliberate step up rather than residual behaviour. A second year would settle it: a payment near Rp100 per share for FY2026 alongside continued deployment would establish a policy where none is written down.
Forward estimates, and how thin they are
Management publishes no forward financial guidance. The FY2025 annual report states that as an investment holding company it does not set quantitative targets for investment deployment, realised gains or net profit, and the section headed "Target for 2026" says the company sets formal annual targets only for operating expenses [55], [56]. There are no earnings calls and no transcripts in any period, so there is no management commentary to model against either.
That leaves a single sell-side model. The figures below are the consensus as compiled for this report, with one contributing estimate on earnings and dividends.
Source: consensus estimates as compiled for this report; one contributing analyst on earnings and dividends. The 2025 row is the estimate, not the reported outcome.
Two things are worth extracting from it, and one warning.
The model strips fair value out entirely. Its forecast operating result is roughly minus Rp250 billion to minus Rp300 billion a year — the holding company's cost base and nothing else — with dividends carried below that line. The widely quoted "EPS growth" figures for Saratoga therefore compare a normalised forecast against a mark-inclusive actual: the 2025 estimate of Rp66.3 sits against reported basic earnings of Rp540 per share [57], and the resulting "decline" for 2026 is an artefact of the two bases, not a forecast of deterioration.
On its own terms, the model puts normalised earnings at Rp148.3 per share for 2026 and Rp194.5 for 2027. At Rp1,760 that is 11.9 times 2026 and 9.0 times 2027. The dividend line reads Rp103.5 for 2026 — within rounding of the Rp103.3 already paid in June — then Rp77.4 for 2027, a 25% reduction. Whether that reflects a view on sustainability or simply a payment-year convention cannot be determined from the data available; either way, the one house modelling this stock does not carry Rp103 forward as a run rate. The mean twelve-month price target is Rp2,850, and one covering broker cut its target to Rp2,600 from Rp3,000 in July 2025.
The warning is reconciliation. The model's 2025 normalised net income of Rp898 billion is well below the Rp2,294 billion of recurring cash the audited cash flow statement shows [58]. Whatever normalisation produces that gap is not disclosed, and with a single contributor there is no second model to triangulate against. These estimates are one house's view and should be read as such rather than as a market consensus.
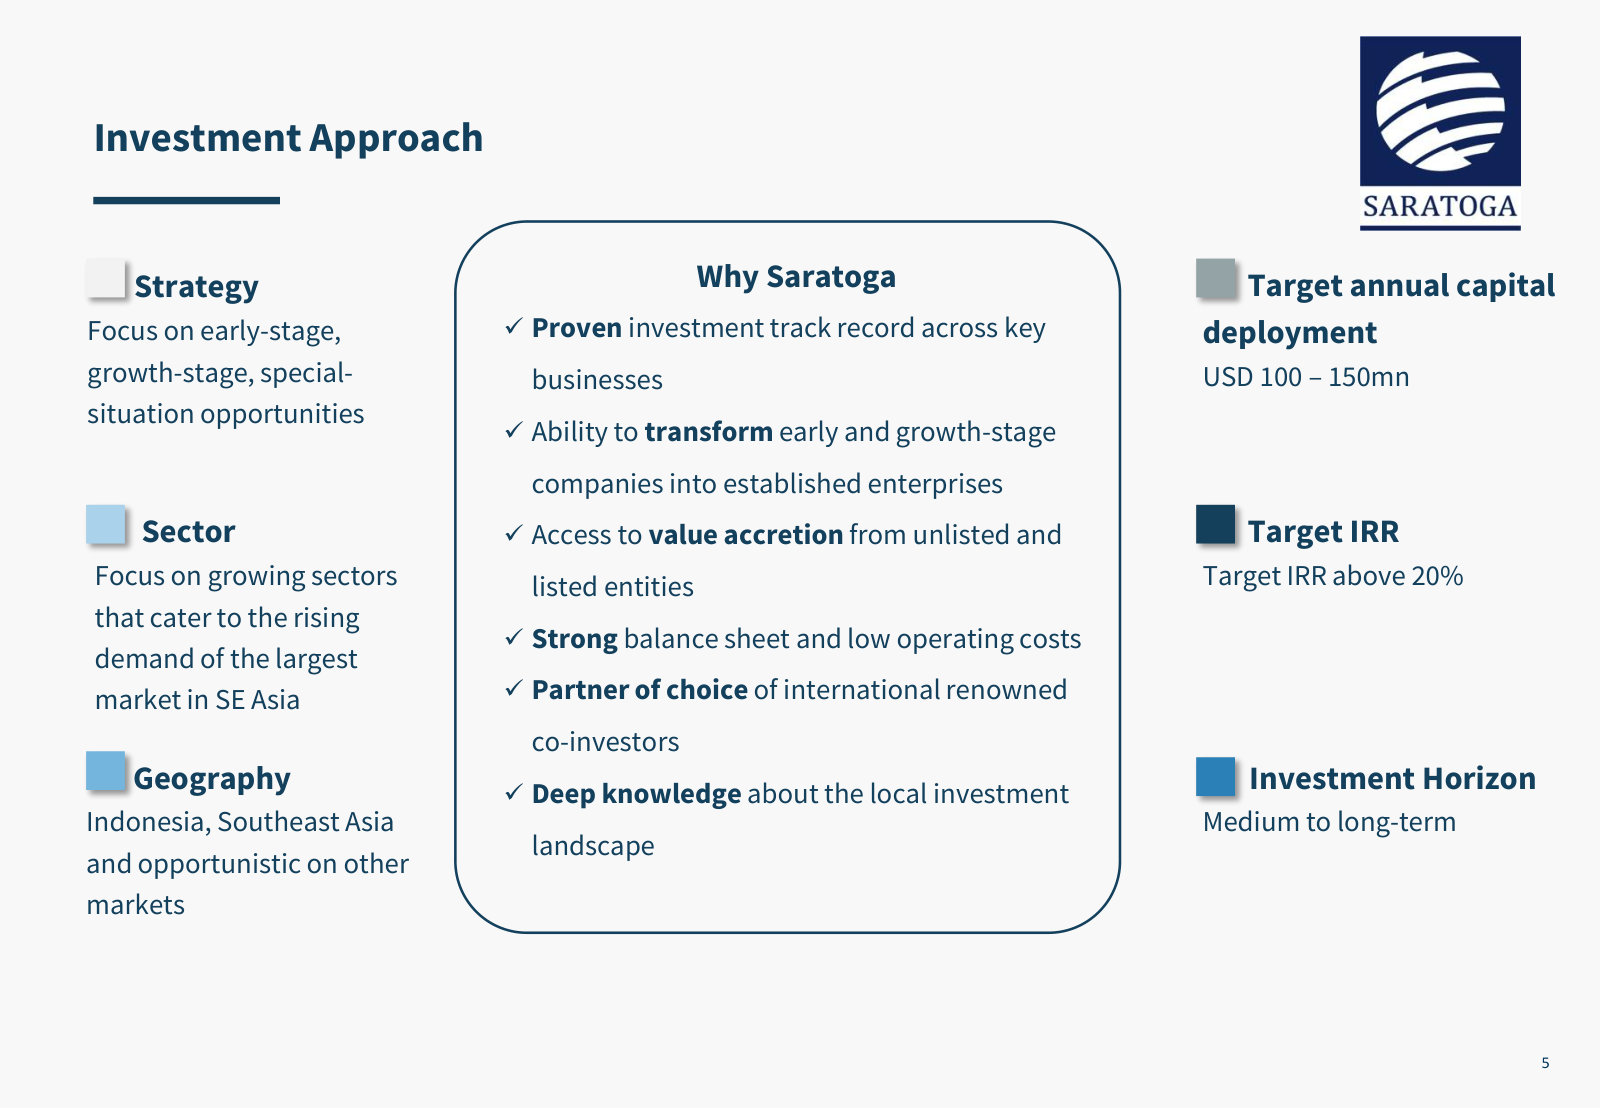
The more useful forward number comes from management by way of the press: a target of US$100–150 million of new investment a year, in healthcare, renewables, digital infrastructure and consumer [59]. At the year-end 2025 rate of Rp16,782 to the dollar [60] that is Rp1,678 billion to Rp2,517 billion. Placed against the FY2025 recurring cash base of Rp2,294 billion, the deployment target alone absorbs 73% to 110% of it, and the Rp1,401 billion dividend absorbs a further 61%. Together they claim 134% to 171% of recurring cash income. On the FY2024 base of Rp3,959 billion the same two claims are 42% to 64% and 35%, or 78% to 99% together, and were covered. The squeeze is a function of Alamtri halving its dividend and of a distribution seven times the prior year's, not of a standing shortfall.
Funding the stated deployment target and repeating the 2026 dividend at FY2025 cash-income levels would require roughly Rp0.8 trillion to Rp1.6 trillion a year from disposals or new borrowing. On the FY2024 cash base of Rp3,959 billion the same two claims came to 78% to 99% and needed nothing.
That is not a solvency observation. With Rp796 billion of borrowings against Rp1,027 billion of cash and deposits at 31 March 2026 [61] and a Rp60 trillion portfolio behind it, the company has ample capacity to borrow or sell. It is an observation about which of the three uses gets cut when coal dividends fall, and the 2024 and 2025 record answers it: the dividend did.
What would change the read
Three developments would move this analysis materially, and each is observable within a year. Alamtri and Adaro Andalan declaring 2026 dividends at or above 2025 levels would confirm the cash base at roughly Rp2.3 trillion; the sensitivity is straightforward, since every Rp500 billion of lost coal dividends is 22% of that base and Rp37 per share. Tower Bersama or Merdeka Copper Gold initiating a meaningful distribution would begin to close the gap between where the value sits and where the income comes from, and would be the most valuable single change to the cash profile. And a written payout policy — a stated share of dividends received rather than a percentage of a mark-to-market profit — would convert the largest per-share dividend in the company's history from an event into a claim, which is the difference between a 5.9% yield that can be underwritten and one that cannot.
Web research was unavailable throughout this run, so no broker note, investee dividend announcement or post-March-2026 disclosure could be checked beyond what the corpus and the compiled estimate data contain. The composition of the portfolio itself is treated in Portfolio and Discount; what this chapter adds is that the cash and the value inside it are carried by different assets.
What sits under the net asset value
Saratoga's net asset value is, in practice, four positions: a tower operator, a copper-gold-nickel miner, the two halves of the former Adaro coal group, and a motorcycle distributor. Their combined mark was Rp48,926 billion at the end of 2025 against Rp53,000 billion four years earlier, while everything else in the portfolio grew from Rp6,799 billion to Rp11,842 billion. A 10% move in those share prices changes reported equity by Rp4,617 billion in the audited accounts.
The four are held in different ways, and only one of them is held directly in full. Merdeka Copper Gold is a straight 19.37% registered holding. Tower Bersama is 31.61%, of which only 9.37% is held through a wholly-owned subsidiary — the remaining 22.25% comes through Bersama Digital Infrastructure Asia, a Singapore company in which Saratoga holds 27.38% and which also owns assets other than towers [1]. The coal exposure is spread across four line items: 4.00% of Alamtri held directly, 4.38% of Adaro Andalan held directly, and 25.00% and 29.79% stakes in two associates, Adaro Strategic Capital and Adaro Strategic Lestari, whose fair value the notes describe as "mainly" representing indirect interests in the same two coal companies [2]. Mitra Pinasthika Mustika is 57.7% owned and still carried at its quoted price rather than consolidated [3].
Sources: valuations and effective ownership from the FY2025 Annual Report net asset valuation table [4]; business descriptions from the 2025 Portfolio Highlights [5], [6], [7], with Mitra Pinasthika Mustika's Honda distribution rights and JACCS MPM Finance stake from the FY2022 Annual Report [8].
Operationally, these are unlike each other in almost every respect that matters. Tower Bersama sells space on more than 24,300 telecommunication sites and distributed antenna networks under long-term contracts [9]; at the end of 2024 it carried over 42,000 tenants across nearly 24,000 sites [10]. Merdeka's economics are set at the mine gate: in 2024 the Tujuh Bukit gold mine produced 115,867 ounces at an all-in sustaining cost of USD1,337 per ounce against an average selling price of USD2,371, Wetar produced 13,902 tonnes of copper, and Merdeka Battery Materials produced 82,161 tonnes of nickel pig iron and 50,315 tonnes of high-grade nickel matte [11]. Alamtri's forward case rests on a smelter: ADMR's aluminium plant was scheduled to begin operating in December 2025 at 500,000 tonnes a year, with planned expansion to 1.5 million tonnes [12]. Adaro Andalan is the thermal coal half of the old group, described by Saratoga as navigating "a normalizing global pricing environment" by growing volumes [13]. A contracted lease book, a mine, a smelter project and a coal seam do not respond to the same variables, and the record of the last five years shows it.
How the four marks moved, 2021 to 2026
Saratoga publishes each holding's mark every year, so the trajectory is checkable rather than inferred.
Source: net asset valuation tables in the FY2021 [14], FY2022 [15], FY2023 [16], FY2024 [17] and FY2025 [18] Annual Reports; coal is Adaro Energy Indonesia, renamed Alamtri Resources, plus Adaro Andalan from 2024.
Added together, the four were worth Rp53,000 billion at the end of 2021 and Rp48,926 billion at 31 December 2025 — 7.7% lower after four years. That comparison is dated, and the next balance sheet reverses it. On note 5 of the 31 March 2026 interim, Tower Bersama is carried at Rp3,449 billion directly plus Rp7,640 billion through Bersama Digital, Merdeka at Rp14,882 billion, and the four Adaro line items at Rp3,031 billion, Rp3,878 billion, Rp13,549 billion and Rp5,401 billion — about Rp51,830 billion for those three names at 31 March 2026 against Rp50,103 billion for the same three at the end of 2021, 3.4% higher [19]. The four-year decline below is therefore a 31 December 2025 fact rather than a standing one. Tower Bersama was marked at Rp18,663 billion against Rp22,879 billion; Merdeka at Rp10,806 billion against Rp16,299 billion; the coal holdings, taken together across the 2024 separation, at Rp17,015 billion against Rp10,925 billion. The rest of the portfolio moved the other way, from Rp6,799 billion to Rp11,842 billion. But that increase is largely bought rather than compounded: Saratoga deployed Rp2,152 billion of cash into investments in 2023 [20] and Rp5,772 billion and Rp2,765 billion in 2024 and 2025 [21] — Rp10,689 billion in three years, part of which went into the four core names as well. Neither number is a return.
Two of the moves need qualifying rather than reading straight. Tower Bersama's 2022 fall from Rp22,879 billion to Rp14,318 billion is roughly half price and half structure: the share price went from Rp2,950 to Rp2,300, but effective ownership also dropped from 34.2% to 26.7% in the Bersama Digital restructuring, before recovering to 31.5% in 2023 [22], [23]. And the 2024 jump in the coal line reflects the separation of Adaro Andalan from Alamtri, not a doubling of the underlying business.
The choice of starting year does most of the work in any judgment here, and it should be stated rather than buried. Measured from the end of 2020, the same portfolio went from Rp34,507 billion to Rp60,768 billion, and net asset value per share from Rp2,337 to Rp4,444 [24]. Measured from the end of 2021, after the commodity surge had already been captured, net asset value per share rose from Rp4,152 to Rp4,444 — 7.0% over four years, before the Rp275 per share of dividends paid in the same window [25], [26], [27]. On the company's own disclosed Bank Indonesia mid rates, the rupiah went from 14,269 to the dollar at the end of 2021 to 16,782 at the end of 2025, so in dollar terms that per-share net asset value is 9.0% lower than it was four years ago [28], [29].
The operating line beneath the marks tells the same cyclical story. Saratoga's own investor presentation tracks the aggregate revenue of its listed portfolio: Rp17,401 billion in 2018, rising to Rp58,143 billion in 2022, then falling to Rp44,728 billion in 2023 [30]. The 2021 peak in the marks was a coal price event before it was anything else — Newcastle thermal coal went from USD80 a tonne at the start of 2021 to USD150 by year-end, touching more than USD200 in the third quarter [31].
Source: Saratoga investor presentation, January 2025 [32]. The presentation also shows a nine-month 2024 figure of Rp50,091 billion, which is not comparable to the full years and is excluded here.
The internal offset and its limits
Whether the portfolio's parts hedge each other is answerable from the year-by-year changes rather than from any statement management makes.
Source: FY2025 Annual Report, net asset valuation table [33]. The five components sum to the reported Rp5,113 billion increase in the sum of investee companies.
In 2025 the coal holdings lost Rp4,160 billion of value while Tower Bersama and Merdeka gained Rp5,865 billion between them, and Saratoga attributes the year's Rp4,140 billion net investment gain specifically to those two share prices [34].
The offset is worth being precise about, because only part of it is durable. Against coal, Tower Bersama has moved the other way in every one of the last four years: coal up 71% and towers down 37% in 2022 — a move that was half ownership change, as noted above — coal down 38% and towers up 15% in 2023, coal up 83% and towers down 3% in 2024, coal down 20% and towers up 17% in 2025. Merdeka has not. It rose with coal in 2022, fell with coal in 2023, and only diverged in 2024 and 2025. The year that matters most for a reader sizing downside is therefore 2023, when Merdeka fell Rp5,985 billion and Adaro Energy fell Rp7,135 billion together and the whole portfolio dropped 20% [35]. Roughly half the portfolio is metals and coal, and those two have moved together as often as apart. The tower stake is the genuine counterweight, and it is 30.7% of the book.
The fourth holding has done neither. Mitra Pinasthika Mustika has been marked lower in every year of this record — Rp2,897 billion in 2021, then Rp2,834, Rp2,657, Rp2,492 and Rp2,442 billion — a 15.7% decline in the one operating business Saratoga controls outright.
Saratoga names a narrower version of this in its risk disclosures, where it says that "certain investments, such as in ADRO and MDKA, provide a natural hedge against the Company's U.S. dollar liabilities" [36]. That is a currency point, not a cycle point, and the dollar borrowings it hedges were down to USD15.0 million at the end of 2025, against USD50.5 million of dollar cash [37].
The company also trades around these positions more than a static holding table suggests. In 2025 it bought 121,764,199 Merdeka shares on 5 March, taking its stake to 20.08%, then sold 211,103,896 shares on 26 August, bringing it back to 19.47% — buying before a year in which Merdeka's marked price rose from Rp1,615 to Rp2,280, and trimming into it [38], [39]. Effective ownership of Alamtri rose from 15.78% to 16.52% and of Adaro Andalan from 14.21% to 15.15% over the same year, as those marks fell [40]. The filings do not separate purchases from the effect of investee buybacks, so the direction is clear but the mechanism is not.
Where management says the next capital goes
The forward sector list in the FY2025 report is short and consistent across both places it appears. The Board of Directors writes that capital is going toward "healthcare, digital infrastructure, renewables, and consumer", underpinned by demographics and the sustainability agenda and offering "multi-decade growth potential beyond cyclical trends" [41]. The Business Prospects section names the same four [42].
Against the holdings table, that list describes where the company intends to go rather than where it currently is. Tower Bersama qualifies as digital infrastructure and is 30.7% of the portfolio. Metals and coal — Merdeka, Alamtri and Adaro Andalan, 45.8% of the portfolio between them — are not named, though Alamtri's renewables arm and Merdeka's battery-materials business sit adjacent to two of the four themes. The phrase "beyond cyclical trends" is attached to those four forward sectors, not to the holdings the company owns today. Healthcare, renewables and consumer sit almost entirely inside the Rp11,842 billion of everything else.
The segment note shows how that smaller half is performing. Saratoga reports three segments — Blue Chip, Digital Technology and Growth Focused. In 2025 the Growth Focused segment produced Rp1,498 billion of income against a Rp288 billion loss in 2024, with reportable assets up from Rp7,393 billion to Rp9,460 billion. The Digital Technology segment lost Rp300 billion in 2025 after losing Rp266 billion in 2024, and its reportable assets fell from Rp934 billion to Rp716 billion [43]. Two consecutive loss years and a 23% decline in carrying value is a small number against a Rp60,768 billion portfolio, but it is the only part of the book where the newer strategy has a track record long enough to read.
How investee trouble reaches the balance sheet
Saratoga does not consolidate its investees and does not guarantee their debt. The FY2025 consolidated statements carry no contingent-liability note and disclose no guarantee given in favour of any portfolio company. The link the filings do disclose between an investee's share price and Saratoga's own obligations sits in the borrowings note: "The outstanding loans are secured by pledges of TBIG, MPMX, MDKA and/or ADRO shares, owned (directly or indirectly) by the Company. The Company is also required to maintain a certain minimum investment market value to debt." [44] The same wording appears in the 31 March 2026 interim statements, by which point borrowings had fallen to Rp796 billion [45].
That is a margin-loan structure, and the minimum ratio itself is not disclosed. What is disclosed is how much headroom sits above it.
Sources: loan-to-value as disclosed in the FY2021 [46], FY2022 [47], FY2023 [48], FY2024 [49] and FY2025 [50] Annual Reports; the 2020 figure is as restated in the FY2021 report.
The stress arithmetic is undemanding. The most levered recent year-end was 2024, with Rp1,670 billion of net debt against a Rp55,655 billion portfolio [51]. Repeating 2023's 20% portfolio fall from that position would have taken loan-to-value from 3.0% to 3.8%; halving the portfolio would have taken it to 6.0%. On the end-2025 position of Rp484 billion against Rp60,768 billion, a 50% portfolio fall gives 1.6% [52]. Where the covenant's own minimum sits is not disclosed, so the distance to it cannot be measured from these accounts; what the disclosed arithmetic does show is a loan-to-value that has stayed between 0.5% and 8% across six year-ends and that stays in single digits when either recent position is halved. On the evidence available, the holding company's own solvency is not where the risk in this security sits.
The risk that can be sized from these accounts is mark volatility, and they quantify it directly. A 10% move in the relevant share prices at 31 December 2025 changes reported equity and profit by Rp1,866 billion for Tower Bersama, Rp1,426 billion for Alamtri and Adaro Andalan together, Rp1,081 billion for Merdeka and Rp244 billion for Mitra Pinasthika Mustika [53].
Source: FY2025 Annual Report, Note 18 Financial Risk Management, share price risk sensitivity as at 31 December 2025 [54].
Those four sensitivities total Rp4,617 billion — 19.3% of the Rp23,874 billion market capitalisation at the 27 July 2026 close, and 7.7% of published net asset value. One disclosure detail is worth flagging. The Tower Bersama, Merdeka and Mitra Pinasthika sensitivities are each exactly one-tenth of the value the net asset valuation table carries for them. The Alamtri and Adaro Andalan line is not: it implies a base of Rp14,263 billion against the Rp17,015 billion the same accounts carry for the four coal-linked holdings, a Rp2,752 billion difference. In the FY2024 accounts the equivalent gap was Rp5,800 billion [55], [56]. The 31 March 2026 interim restates the same gap rather than closing it: it shocks Adaro Andalan by 20% for Rp2,250 billion and Alamtri by 10% for Rp1,044 billion, implying a combined base of Rp21,689 billion against Rp25,859 billion of coal carrying value on the same statements — a Rp4,170 billion difference, 16.1% [57]. The gap runs 27% of coal carrying value at end-2024, 16% at end-2025 and 16% at 31 March 2026 — narrowing in proportion, widening in rupiah, and present at every balance-sheet date in this record. The likely explanation is the "mainly" in the associates footnote — Adaro Strategic Capital and Adaro Strategic Lestari hold assets besides coal shares — but the notes do not reconcile it, and the reader is left unable to size the coal exposure to better than a Rp2.8 trillion band at end-2025, or a Rp4.2 trillion band at the latest date.
Two smaller exposures complete the picture. Saratoga carried Rp732 billion of receivables at the end of 2025, of which Rp705 billion was declared but unpaid dividends from the Adaro complex and Rp27 billion a loan to a growth company; against a gross balance of Rp798 billion the group carries Rp66 billion of impairment, down from Rp108 billion a year earlier [58], [59]. And the leverage that does exist sits at the investees, where Saratoga's own filings record it without consolidating it: Tower Bersama issued USD650 million of dollar bonds and IDR6.5 trillion of rupiah bonds in 2021 [60], IDR5.4 trillion in 2022 [61], IDR5.5 trillion in 2023 [62] and IDR4.7 trillion in 2024 [63]. Of the IDR15.6 trillion raised in rupiah over those three years, IDR13.1 trillion carried a 370-day tenor — a book that is refinanced continuously rather than termed out, alongside a USD325 million revolving facility extended to October 2029 [64]. On the mining side, Merdeka raised IDR12.0 trillion across four bonds in 2022 [65], and in 2025 alone issued a further IDR2.8 trillion while Merdeka Battery Materials issued IDR16.8 trillion of sukuk [66].
Saratoga's own risk table concedes the exposure without quantifying it, listing "Exposure to Industry Risk in Which Our Investees Operate" and answering it with diversification and "regular performance and risk reviews" [67].
What would change the read
The read here is that the four core holdings are large, liquid positions whose aggregate mark at 31 December 2025 was 7.7% lower than four years earlier, a decline the March 2026 interim has since erased; that the tower stake has offset the commodity holdings in each of those four years while Merdeka has offset them in only two; and that investee leverage is substantial but reaches Saratoga only through a pledge covenant with headroom a repeat of the worst drawdown in this record would barely touch. Three things would move it.
If Adaro Andalan and Alamtri sustain distributions through a soft coal price — the January 2026 USD250 million interim already approved is one data point [68], against USD300 million paid in June 2025 for the prior year [69] — the coal half of the portfolio behaves more like an annuity than a price bet, and the 2025 marks understate it. If the ADMR aluminium smelter ramps to its 500,000 tonne phase one and Merdeka's downstream nickel projects convert capital expenditure into cash, the metals half becomes a compounder rather than a price proxy. And if the Growth Focused segment repeats 2025's Rp1,498 billion of income for another two years, the case stops depending on the four core names.
The strongest fact against this read is the one that ends the section above: the unreconciled gap between the coal carrying value and the coal sensitivity base — Rp2,752 billion at end-2025 and Rp4,170 billion at 31 March 2026 — means the exposure cannot be sized precisely from these accounts. A reader who needs that precision has to go to Alamtri's and Adaro Andalan's own filings.
Two limits on this chapter should be stated plainly. None of the investees' own financial statements are in this corpus — every operating figure above is Saratoga's description of a company it does not control, published in its own annual report, and the investee-level balance sheets that would settle a look-through leverage question are not here. And web research was unavailable throughout this run, so no commodity price data, broker work or investee disclosure after March 2026 could be checked. The related question of what the unlisted 15% of the portfolio is actually worth is unexamined, as is the record of realisations across Saratoga's full listed life.
Marks Without Prices
Roughly Rp9.1 trillion of Saratoga's Rp60.7 trillion portfolio has no quoted price behind it. The audited notes describe the methods in three short paragraphs, disclose no discount rate, multiple or range, and state that a sensitivity analysis would not be practicable. That slice has tripled as a share of the portfolio since 2022, though the step is not a trend: most of the rise landed in a single year, 2023, and the two years since have been flat at about 15%. Writing all of it to zero moves the discount to published net asset value from 60% to 53%.
Unpriced book (Rp bn)
Share of portfolio
Discount if written to zero
Sources: FY2025 audit report, key audit matter [1]; FY2025 Annual Report, Note 17 Fair Value of Financial Instruments [2]; discount derived from the Rp1,760 close of 27 July 2026.
How big the unpriced book is
The auditor draws the line. At 31 December 2025 the Group held Rp34,543,686 million of Level 2 and Level 3 investments, including those measured at cost — 55.26% of consolidated assets — and of that, Rp25,485,721 million sits in entities that themselves own directly-quoted listed shares [3]. Those are the Bersama Digital and Adaro Strategic holding vehicles, whose value moves with TBIG, ADRO and AADI screen prices. The residual — Rp9,058 billion — is the part that does not trace to any quoted instrument. It is 14.9% of the Rp60,659 billion of investments the balance sheet carries, and 38% of Saratoga's Rp23,874 billion market capitalisation.
Four consecutive audit reports state the same two figures, so the series can be built on the auditor's own definition rather than a constructed one.
Sources: key audit matters, FY2022 [4], FY2023 [5], FY2024 [6] and FY2025 [7]; portfolio totals from the fair value hierarchy tables, FY2023 [8] and FY2025 [9].
Both halves of the ratio moved. The unpriced balance rose from Rp3,054 billion to Rp9,058 billion over three years while the portfolio itself first shrank — Rp61,518 billion at end-2022 to Rp49,008 billion at end-2023 as listed marks fell — then recovered to Rp60,659 billion [10] [11]. The management discussion reports the same trend in its own words: non-listed entities Rp5,142 billion at end-2025 against Rp3,647 billion a year earlier, up 41% [12].
Where the 2025 increase came from
Level 3 investments in shares went from Rp1,914,320 million to Rp5,143,569 million during 2025 [13]. Note 5's position-by-position table lets that Rp3,229,249 million increase be rebuilt, and most of it is accounting category rather than value.
Source: derived from Note 5 Investments in Shares, FY2025 Annual Report [14] [15] [16], and Note 17 [17].
Rp2,627,512 million of the increase — 81% — is positions arriving at their existing carrying values. Growth companies 9 and 10 were carried at cost of Rp1,472,491 million and Rp259,748 million at end-2024 and are Level 3 at end-2025 [18]. Growth companies 11 and 12 had no 2024 line at all; the footnote says their value was previously inside the Bersama Digital mark, and the BDIA footnote puts the non-tower assets held there at Rp895,273 million [19] [20].
The two positions that came off cost are now carried 24.0% and 22.8% above their prior-year figures — Rp412,592 million between them, 10% of the Rp4,107,537 million of fair-value gains booked on investments in shares for the year [21]. How much of that is fresh cash and how much is the change in measurement basis is not disclosed. Note 5's roll-forward runs by strategy bucket, not by hierarchy level, and its 2025 presentation merges additions with reclassifications into a single column where the 2024 version showed additions alone [22].
The timing points to the two investments made in 2024. Saratoga acquired a majority stake in the Brawijaya hospital chain in the first quarter of 2024 and a significant minority of the food-ingredients maker Foodex in the first half [23]. The cost approach applies for twelve months after acquisition [24], the two positions carried at cost at end-2024 hold ownership bands of above 50% and 20-50% matching those two deals, and both moved onto models a year later. The note anonymises, so this is an inference from ownership band and timing rather than a disclosure.
What stands behind the numbers
Note 17 sets out three methods. Anything bought in the last twelve months is held at cost. Where an investee's own net assets are themselves Level 1, Saratoga uses the carrying amount of those net assets. Everything else is valued by management using discounted cash flow and comparable-company multiples [25]. No discount rate, growth rate, multiple or valuation range appears anywhere in the accounts, and no external valuer is named. The note then closes the question explicitly: because the investees span varied industries with unique assumptions, "providing an aggregated disclosure of sensitivity analysis on the key inputs used would not be practiceable nor meaningful" [26].
That is a standing position, not a new one. The same statement sits in the FY2021 accounts [27] and in the Q1 2026 interim statements [28]. The reasoning is defensible for a portfolio of a dozen unrelated private businesses; the consequence is that the 15% of net asset value most exposed to judgment is the 15% for which no quantified sensitivity exists.
The contrast within the same set of accounts is sharp. Note 18(e) discloses, holding by holding, what a 10% share-price move does: Rp1,866,273 million for Tower Bersama, Rp1,426,264 million for the Adaro complex, Rp1,080,604 million for Merdeka and Rp244,153 million for Mitra Pinasthika — Rp4,617 billion in total [29]. Price risk is quantified precisely for the 85% that is observable and not at all for the 15% that is not.
Two further features limit what an outside reader can do with the unlisted table. The anonymised labels are not stable identifiers: the FY2023 report shows Growth company 9 at Rp135,290 million at 31 December 2023 [30], while the FY2024 report's comparative column for that same date shows Growth company 9 at Rp318,975 million and Growth company 6 at Rp135,290 million [31]. Tracking one private position across two annual reports is not possible from the published numbering.
And the investor-facing net asset value table takes the presentation one step further out. Every listed holding is shown with its effective ownership and its closing share price; the unlisted book appears as a single "Others" line under Growth Focused of Rp6,298 billion, against Rp4,330 billion a year earlier, with no price, no ownership percentage and no components [32]. That table also sits outside the audit. The auditor's report covers the consolidated financial statements only and records that the 2025 Annual Report "is expected to be made available to us after the date of this auditors' report" [33]. The Rp4,444 per share against which the whole discount is measured is management's own presentation, built from audited components.
What the marks have done when they moved
The one unlisted bucket old enough to show a full cycle is digital technology, and it has been marked down almost to nothing.
Sources: Note 5 Investments in Shares, FY2021 [34], FY2023 [35] and FY2025 [36].
From the Rp525,293 million peak at end-2022 the bucket is down 90%, and 2025's Rp240,092 million decline was Rp236,046 million of fair-value change against Rp4,046 million of divestment [37]. The exits from that book, examined in Realisation Record, were almost entirely markdowns rather than sales. What that record establishes about the estimates themselves is that they are revised, and revised hard, when the underlying businesses disappoint — a point in favour of the marks as much as against them.
The stronger evidence for management on this question comes from 2023. Saratoga reported a Rp13,811,067 million net loss on investments in shares and other securities that year, the largest in its listed history [38]. Level 3 investments in shares nonetheless rose from Rp1,395,722 million to Rp1,617,926 million over the same twelve months [39]. The write-down came from quoted prices, not from a discretionary sweep of the unlisted book while attention was elsewhere. Nor do the growth marks run one way: the growth-focused bucket took Rp594,610 million of negative fair-value change in 2024 before adding Rp1,134,325 million in 2025 [40].
What a haircut does to the discount
The unpriced book is Rp9,058 billion, or Rp668 per share on 13,564,835,000 shares. That is the auditor's line. The company's own net asset value table draws a wider one: four of its rows carry no share price at all — blue-chip "Others" at Rp1,546 billion, growth-focused "Others" at Rp6,298 billion, digital technology at Rp716 billion and other shares and securities at Rp2,588 billion, Rp11,148 billion together, or Rp822 per share [41]. The Rp2,090 billion between the two is definitional: the investor table treats a line as unpriced when it prints no share price, while the auditor treats it as unpriced only when nothing behind it traces to a quoted instrument. A reader who meets Rp668 here and Rp822 in Discount Arithmetic is seeing the narrow and the wide measure of the same book, not two different books.
A bottom-up alternative to either — checking each unlisted mark against the investee's own accounts — cannot be built from these filings: the corpus carries operating milestones for the private book, Brawijaya's six hospitals and the roughly 100-bed Taman Mini opening [42], ZAP's nearly 118 clinics [43], Xurya's 100 MW of operating solar capacity [44], but no revenue, earnings or balance sheet for any of them. A haircut grid is therefore the bound this chapter can offer. Applying a haircut to all of the auditor-definition book and holding the rest of the published net asset value constant gives the following.
Source: derived from the FY2025 fair value hierarchy [45], the audit report's Level 2 split [46] and the published net asset value table [47]; share price at the 27 July 2026 close.
The read this supports: the unpriced book is not what creates the discount, and it is not large enough to remove it either. A complete write-off of every rupiah that does not trace to a quoted price still leaves the shares 53% below the remainder. For an investor working from a margin-of-safety frame, the estimation risk in the notes is bounded at roughly seven points of a sixty-point gap.
The fact that cuts hardest against reading the unpriced book as immaterial runs the other way, and it is about direction of travel rather than level. The three net asset value lines outside the blue-chip block carrying no share price — growth-focused "Others", digital fund investments, and other shares and securities — went from Rp7,674 billion to Rp9,602 billion during 2025, an increase of Rp1,928 billion [48]. That is Rp142 of the Rp464 by which published net asset value per share rose during the year — 31% of the gain, from lines an outside reader cannot verify. The slice is small enough to survive a write-off and large enough to move the reported number, and both statements matter.
What would change the read in either direction is the same event: a transaction. A listing or trade sale of one of the larger private positions would price the model against a market for the first time since the digital book began its decline, and would say more about the reliability of the remaining Rp9 trillion than any further disclosure. Failing that, a Level 3 reconciliation separating transfers from revaluation, or the unobservable-input table the accounts currently decline to give, would let the next reader do the work this chapter had to do by inference.
Discount Arithmetic
This report has quoted Saratoga's discount to net asset value throughout. This chapter builds it from the price up. At Rp1,760 the whole company costs less than the two largest quoted stakes it owns. Zeroing the unpriced book, charging every deferred tax and capitalising the holding-company cost forever still leaves Rp1,539 per share of gap that no disclosed item accounts for.
Close, 27 Jul 2026 (Rp)
Published NAV/share, 31 Dec 2025 (Rp)
NAV/share, 31 Mar 2026 less June dividend (Rp)
Discount on that basis
Sources: Net Asset Valuation as of 31 December 2025 and 2024 [1]; IDX close of 27 July 2026 [2]; 31 March 2026 interim statement of financial position [3]; dividend from the 12 June 2026 payment [4].
What Rp1,760 buys
Saratoga's own net asset table gives an effective ownership percentage, a closing share price and a valuation for seven listed holdings, and shows the rest of the book as four unpriced lines [5]. Divided across the 13,564,835,000 shares in issue [6], the seven priced stakes come to Rp3,658 per share, the four unpriced lines to Rp822, and net debt subtracts Rp36 — Rp4,444 in total.
Source: derived from the Net Asset Valuation table at 31 December 2025 [7] and the 13,564,835,000 shares in issue [8].
Tower Bersama alone covers 78% of the share price. Adding Merdeka Copper Gold covers it 1.23 times. Both are IDX-listed, both are marked in the table at their own closing screen prices — Rp2,680 and Rp2,280 at 31 December 2025 [9]. On that arithmetic a buyer at Rp1,760 pays for those two positions at a 19% discount and receives the coal complex, the controlled distribution business, the industrial gas and construction stakes, the entire unlisted book and the net cash position at no cost. The same sentence stated the other way: the seven priced stakes net of debt are worth Rp3,622 per share, and the market pays 48.6 cents per rupiah of them.
That is a statement about price, not about quality. The marks themselves are only as good as the screen prices behind them, and those prices move — the coal pair fell Rp4,160 billion during 2025 while Tower Bersama and Merdeka rose Rp5,865 billion [10].
The gap, decomposed
Three of the four candidate explanations for the gap can be sized from the filings. The fourth is what is left.
Sources: unpriced lines and NAV per share from the Net Asset Valuation table [11]; deferred tax liability from the consolidated statement of financial position [12]; operating expenses from the consolidated statement of profit or loss [13]; residual derived.
The unpriced book. The four lines carrying no share price total Rp11,148 billion, 18.3% of the portfolio, or Rp822 per share [14]. That is the widest available definition of estimation risk; the auditor's narrower one, which strips out the holding vehicles that themselves own quoted shares, puts it at Rp9,058 billion or Rp668 per share (Marks Without Prices). Writing all of it off — which no evidence supports, and which the accounts contradict for the years when Level 3 rose while quoted marks fell — removes at most Rp822 of a Rp2,684 gap.
Deferred tax. The balance sheet carries a net deferred tax liability of Rp2,053,719 million, of which Rp2,024,316 million sits against investments in shares and other securities at the Company level [15] [16]. At the 22% enacted rate that implies a taxable temporary difference of about Rp9,201 billion [17] — far less than the unrealised gain embedded in a Rp60,768 billion portfolio, because Rp3,062,200 million of the Company's 2025 income was deducted in the tax reconciliation as subject to final tax [18]. The accounts do not say which holdings sit inside the final-tax perimeter, so the split cannot be attributed position by position. The deduction is Rp151 per share, 5.6% of the gap. Cash tax actually paid in 2025 was Rp25,883 million [19].
The manager's cost. Operating expenses were Rp232,558 million in 2025 against Rp232,424 million in 2024 [20], 0.39% of net asset value against a 0.43% ratio the year before, and 13% below the Rp267 billion target the Company set for itself [21]. Capitalised in perpetuity at 10% that is Rp2,326 billion, or Rp171 per share. At 7.88% — the top of the rupiah range Saratoga itself pays on secured bank borrowings [22] — it is Rp218 per share. Either figure is a rounding item against the gap — the cost side of the same conclusion in Pay and Alignment.
The residual. Rp4,444 less Rp822 less Rp151 less Rp171 is Rp3,299. The price is Rp1,760. The difference — Rp1,539 per share, Rp20,881 billion, 35% of published net asset value — is applied to a book of listed stakes marked at their own screen prices, after every named haircut has already been taken.
A fresher balance sheet does not narrow it
The published net asset value is seven months old. The 31 March 2026 interim balance sheet allows the same calculation on more recent marks: investments in shares of Rp63,326,007 million, other securities of Rp4,143,299 million, investment property of Rp109,642 million, cash and time deposits of Rp1,026,895 million and borrowings of Rp795,960 million [23]. That construction reproduces the published Rp4,444 exactly when run on the 31 December 2025 balance sheet [24] [25], which is the check that makes it usable.
On 31 March 2026 it gives Rp67,810 billion, or Rp4,999 per share. The Rp1,401 billion dividend paid on 12 June 2026 [26] takes it to about Rp4,896. Against the Rp1,760 close [27] that is a 64.0% discount, not 60.4%. The March quarter also moved the composition: Level 1 investments in shares rose from Rp26,112,930 million to Rp31,490,714 million while Level 3 was almost unchanged at Rp5,245,466 million [28], so the increase came from quoted prices rather than model marks. Two caveats bound this: the figure is a reconstruction from an interim balance sheet rather than a published net asset value, and four months of portfolio price movement since 31 March are not in it.
What the price pays for the cash
The gap can also be read as a yield, using only cash that actually moved. The 2025 recurring receipts less the operating payments against them net to Rp2,294 billion, Rp169 per share — the line-by-line build is the opening table of Cash Income and Estimates [29]. On the same 2024 lines it was Rp3,959 billion, Rp292 per share [30].
FY2025 recurring cash / price
FY2024 recurring cash / price
FY2025 dividend yield
Price / FY2025 recurring cash
Sources: derived from the 2025 consolidated statement of cash flows [31], the Rp103.3 dividend paid 12 June 2026 [32] and the Rp1,760 close [33].
At Rp1,760 the shares cost 10.4 times the 2025 recurring cash take and 6.0 times the 2024 one, before any value is placed on the portfolio itself. Saratoga borrows secured rupiah at 5.45% to 7.88% [34], so the equity yields more on cash receipts alone than the company pays its banks — with the difference that the bank has a pledge over TBIG, MPMX, MDKA and ADRO shares and a minimum market-value-to-debt covenant [35], and the shareholder has neither. The swing from 16.6% to 9.6% in one year is the honest limit on this framing: the cash stream is a coal dividend stream, and it halved.
The record the discount has set
Sources: net asset value per share and year-end closing prices from each year's annual report — FY2021 [36] [37]; FY2022 [38] [39]; FY2023 [40] [41]; FY2024 [42] [43]; and FY2025 [44] [45].
The five year-end readings average 48.5%. The trend inside them matters more than the average: 32.6% at the end of 2021, when net asset value per share had just risen 78% on the coal cycle [46], widening in three of the four years since, and reaching 64.4% at the end of 2025 — the widest of the series — in a year when net asset value per share rose 12% [47]. The arithmetic behind that widening is that the share price fell in three of the last five calendar years while net asset value per share rose in four of them.
What has to move
The price is the product of two numbers, and the arithmetic is symmetrical.
Source: derived from the Net Asset Valuation table [48], the 31 March 2026 balance sheet [49] and the 2021 to 2025 discount range; implied prices in Rp per share.
The coal complex — Alamtri plus Adaro Andalan — is Rp17,015 billion, 28.0% of the portfolio and Rp1,254 per share [50]. Halving it, at the current discount, implies Rp1,512. Holding the asset value flat and returning to the 2021 discount implies Rp2,995. The single sell-side target in the corpus, Rp2,850 from the one contributing broker, sits between those and corresponds to a 35.9% discount to published net asset value or 41.8% to the March construction [51]; it is a discount-narrowing forecast, not an asset-value forecast, and it comes from a broker that cut its own target from Rp3,000 to Rp2,600 in July 2025 [52].
The evidence supports treating the discount as a claim on Saratoga's structure rather than on its marks. Estimation risk in the portfolio is bounded at Rp822 per share on the widest definition, tax at Rp151 and the manager's cost at Rp171, which together account for roughly two-fifths of a Rp2,684 gap; the remaining Rp1,539 is applied to stakes carried at prices anyone can look up. The strongest fact against reading that as mispricing is the direction of travel: the discount has widened in three of the last four years, the company's own record of divestments carries no exit from the four core holdings in thirteen listed years, as Realisation Record sets out, the 2025 financing cash flows contain no treasury purchase in the year of the widest year-end discount in the five-year series [53], and PT Unitras Pertama, Edwin Soeryadjaya and Sandiaga Uno together hold 89.00% of the register against a 10.74% public float [54]. A gap that persists through a doubling and halving of the underlying is more plausibly a price for illiquidity and control than an error waiting to correct.
What would change that read, in either direction: a disposal from the core four at or near the marked price, a buyback sized against the discount rather than against the incentive plan, or a formal payout ratio replacing the discretionary policy would each convert net asset value into something a minority holder can reach, and would justify a narrower discount. A second year of dividend income falling with coal, or a Level 3 write-down that arrives through a transaction rather than a model, would justify a wider one.
Two limits on all of the above. External web research was unavailable for this chapter, so no Indonesian government bond yield, no peer holding-company discount and no post-March-2026 corporate action could be checked against the arithmetic; the rate anchor used here is Saratoga's own borrowing cost, taken from its accounts. And the published net asset value table sits outside the audit opinion, which covers the consolidated financial statements only [55] — every discount in this chapter is measured against a number management publishes and the auditor does not sign.
Peer Discounts
Five Indonesian holding companies sit alongside Saratoga in this corpus, and at the end of 2025 they were priced between 0.36 and 8.31 times their own net assets. There is no local holding-company discount to appeal to. The one peer keeping its books on the same fair-value basis traded at 1.01 times net assets with a smaller free float and more debt, having just raised Rp3,617 billion of equity at a premium to book.
Only one peer keeps the same books
Saratoga is a qualifying investment entity under PSAK 110, so its controlled entities, associates and joint ventures are measured at fair value through profit or loss instead of being consolidated [1]. Its reported equity is therefore a marked net asset value, which is why price-to-book and price-to-net-asset-value are nearly the same number here: Rp21,432 billion of market capitalisation at the 31 December 2025 close of Rp1,580 [2] against Rp58,891 billion of equity attributable to owners [3] and Rp60,284 billion of published net asset value [4].
Exactly one peer uses that accounting. PT Provident Investasi Bersama (PALM) states the policy in the same words Saratoga does — controlled entities, associates and joint ventures at fair value through profit or loss under PSAK 109, with the PSAK 110 investment-entity exemption [5]. The others do not. PT Indoritel Makmur Internasional (DNET) equity-accounts its three associates, carried at Rp13.5 trillion or 57% of consolidated assets [6]. PT Multipolar (MLPL) consolidates operating subsidiaries [7] and equity-accounts the rest [8]. Astra International (ASII) and Indika Energy (INDY) are operating groups that consolidate at historical cost. For those four, the multiple below is a price-to-book ratio, not a discount to marked value, and it can move for reasons that have nothing to do with what the assets are worth.
Sources: each company's own 2025 annual report at 31 December 2025 — Saratoga market capitalisation of Rp21,432 billion [9] and equity [10]; Provident [11] and [12]; Multipolar [13] and [14]; Indoritel [15] and [16]; Astra [17] and [18]; Indika [19] and [20]. Indika reports in US dollars; its US$1,345 million of equity is shown at the 31 December 2025 rate of Rp16,667 per dollar. Net assets are equity attributable to owners except for Indoritel, which reports the total.
The spread is the point. Two listed Indonesian investment holdings bracket the range [21]: Indoritel at 8.31 times its own equity, Multipolar at 0.36. Whatever a 60% discount is, it is not something the Indonesian market applies to holding companies as a class.
The like-for-like comparison
Provident is the only comparison that survives the accounting test, and it is a close one. It is an IDX-listed Indonesian investment entity whose 2025 gains came from Merdeka Copper Gold and Merdeka Battery Materials — the same Merdeka complex in which Saratoga holds 19.4% [22] — at Rp1,996.74 billion, alongside Rp221.23 billion from the logistics operator MMLP and Rp8.28 billion from the telecom operator EXCL [23]. It is also a company Saratoga itself owned: a 19.9% stake carried at Rp884 billion at a Rp625 share price at the end of 2023, gone by the end of 2024 [24] after a Rp389 billion negative fair-value change in the exit year [25].
Sources: Saratoga market capitalisation of Rp28,351 billion (2024) and Rp21,432 billion (2025) [26] against equity attributable to owners of Rp51,746 billion and Rp58,891 billion [27]; Provident closes of Rp438 and Rp380 on 15,773,797,158 and 15,732,874,458 shares [28] against equity attributable to owners of Rp4,093 billion and Rp5,940 billion [29].
Leverage does not explain the gap; neutralising it widens it. Provident's marked portfolio was Rp8,665 billion at the end of 2025, against Rp3,211 billion of bank loans and bonds and Rp352 billion of cash [30]. Market capitalisation plus net debt comes to Rp8,837 billion, or 102% of the marked portfolio. Saratoga's investments in shares and other securities stood at Rp60,658 billion against Rp1,450 billion of borrowings and Rp966 billion of cash [31]; the same construction gives Rp21,916 billion, or 36% of the marked portfolio. Adding Saratoga's Rp2,142 billion of other liabilities, which are mostly deferred tax, takes it to 40%. On the marked rupiah, the market pays 102 cents for Provident's portfolio and 36 to 40 cents for Saratoga's.
Float and turnover do not sort the multiples
The most common structural defence is that a closely held, thinly traded holding company cannot be priced properly. The peer set does not support it. Provident is more closely held than Saratoga, not less: four parties own 91.03% and the public holds 8.55% [32], against Saratoga's three principals at 89.005% and a public float of 10.995% [33].
Turnover runs the same way. Saratoga is the third-most-traded name in the set and carries the second-lowest multiple; Indoritel is the least traded by three orders of magnitude and carries the highest.
Sources: Provident, Indoritel and Multipolar report quarterly traded volumes directly [34] [35] [36]; Saratoga [37] and Astra [38] report average daily volume, annualised here at 61 trading days a quarter.
Indoritel traded 132,200 shares in the whole of 2025 — 7,600 in the first quarter — and closed the year at Rp9,075 for a market capitalisation of Rp128,720 billion [39]. That number is arithmetic, not a price at which anything could be sold, and it is the reason the 8.31x at the top of the table should not be read as a re-rating Saratoga could hope for. It does, however, dispose of the idea that illiquidity mechanically produces a discount: here it produced the opposite.
What is actually different about Provident
Five differences are visible in the filings, and they point in different directions.
Provident realises whole positions. During 2025 it sold its entire holding in EXCL in April and its entire holding in MMLP in September [40]. Saratoga's own Investment Milestones name no exit at all for 2025, as the Realisation Record sets out. Two complete exits in one year is the behaviour a discount is supposed to reward, and of the five differences it is the one most likely to be doing the work.
Provident can issue equity. Between 20 March and 4 April 2024 it raised Rp3,617,479,343,236 through a rights issue of 8,654,256,802 shares at Rp418 [41]. Its equity was Rp2,460 billion at the end of 2023 [42] on the 7,119,540,356 shares that preceded the issue, so Rp346 of book per share was sold at Rp418 — a 21% premium. A company priced at net asset value can fund itself by issuing shares; one priced at a third of net asset value cannot. Saratoga's share listing chronology records two corporate actions in its whole listed life: the 2013 initial public offering and the 2021 stock split [43].
Provident retires stock. In May 2025 it cancelled 40,922,700 treasury shares, 0.26% of issued capital, through a capital reduction [44]. Saratoga's own treasury activity feeds its incentive plan rather than the share count, as Pay and Alignment sets out.
Provident has no distribution record to speak of. Its unappropriated retained earnings were negative Rp152,735 million at the end of 2024 and only turned positive, at Rp1,694,373 million, during 2025 [45], and Indonesian law permits a distribution only out of positive retained earnings, as its own dividend policy records [46]. Saratoga paid Rp103.3 a share for FY2025 on 12 June 2026 [47]. Payout does not sort the two multiples either.
Provident is not the cheaper manager. Its operating expenses were Rp40.28 billion in 2025, down 33.04% from Rp60.15 billion [48], which on the Rp8,665 billion marked portfolio is 0.46%, against Saratoga's Rp232,558 million [49] on Rp60,658 billion, or 0.38% — the one comparator that carries its book at fair value runs a higher cost ratio than Saratoga and still trades at net asset value, so cost is not what separates 0.36x from 1.01x.
The strongest fact against reading Provident as the answer is what its own shareholders earned. Its shares closed 2023 at Rp625, 2024 at Rp438 and 2025 at Rp380 [50] [51], while total equity ran Rp2,460 billion, Rp4,093 billion and Rp5,940 billion on losses of Rp3,304 billion and Rp1,983 billion before 2025's Rp1,847 billion profit [52]. The book grew because capital was raised and marks recovered; the share price fell 39% across the two years. Full net asset value is a rating, not a return, and Provident's rating sat above 1.0x through a period in which its holders lost money. Saratoga's own exit during 2024, from a position last marked at Rp625 and counted in the Realisation Record as one of nine in thirteen years, looks better against that price path than against the equity line.
What would change the read
The evidence points one way on the narrow question. A 60% discount is not what the Indonesian market charges for the holding-company format, for concentrated ownership, or for a thin float — the closest-matched comparator has more of all three and trades at net asset value. That leaves conduct and portfolio as the candidate explanations, which is where the difference between two realisations in a year and none actually bites.
The read is bounded by what a single comparator can carry. Provident is a tenth of Saratoga's size, its portfolio is younger and narrower, and its multiple has been anywhere between 1.0x and 1.7x in two years — a range wide enough that the 1.01x at the end of 2025 could be coincidence rather than an equilibrium. A second fair-value-carried Indonesian investment entity trading near book would firm it considerably; none exists in this corpus. What would move the read the other way is Provident's multiple collapsing toward Saratoga's without any change in its conduct, which would suggest that the two ratings were never comparable. What would move it toward the discount being closable is Saratoga selling a whole position at or near its mark — the one behaviour Provident displayed in 2025 and Saratoga has not since 2024.
Realisation Record
Saratoga's own Investment Milestones chart names nine divestments in the thirteen years since it listed, none of them from the four holdings that are four-fifths of the portfolio. Across FY2021 to FY2025 the company collected Rp24,005 billion from disposals and spent Rp30,296 billion on investments. Strip out the 2022 tower restructuring, which recycled most of its own proceeds within the year, and the record is Rp3,805 billion realised against Rp12,006 billion deployed.
Nine named exits since the listing
The 2013 prospectus offered 271,297,000 new shares at Rp5,500 — Rp1,492 billion, 10.0% of the enlarged capital [1]. That prospectus defined sixteen investee companies [2]. Four of them are still identified by name in the net-asset table at 31 December 2025: Alamtri Resources (the renamed Adaro Energy, from which Adaro Andalan was separated), Tower Bersama, Mitra Pinasthika Mustika and Nusa Raya Cipta [3].
The company publishes its own record of what it sold. The Divestment row of the Investment Milestones chart carries entries in five of the thirteen listed years.
Source: Investment Milestones, FY2022 Annual Report [4] and FY2025 Annual Report [5], [6].
The chart records no divestment at all in 2019, 2020, 2021, 2022 or 2025 [7] [8]. The 2018 exit from Batu Hitam Perkasa, the Paiton Energy holding vehicle, is the last named sale of a large infrastructure asset. The four exits recorded since — two hospitals-and-data-centre positions in 2023, two smaller holdings in 2024 — came from the growth book, not from the blue-chip core. Saratoga has never reduced a core position other than by trading around it: Merdeka shares bought in March 2025 and partly sold in August [9], coal weightings raised as those marks fell, and Nusa Raya Cipta taken from 7% to 6.0% during a year in which its quoted price went from Rp352 to Rp1,525 [10].
How the company describes the activity is consistent with that record. The third pillar of its stated approach, after Invest and Grow, is Monetize: "We actively manage our investments and provide our investee companies with a broad range of capital market and strategic placement opportunities" [11]. That is capital-markets access supplied to investees, not realisation of Saratoga's own stakes. The corporate website is the only place that frames exits from the holding company's side: "When the time is right, we capitalize on well-planned exit strategies — through IPOs or trade sales — to deliver optimal returns for our stakeholders" [12].
The flows run the other way
The audited cash flow statements record disposals and purchases as separate operating lines. Over six years they look like this.
Sources: consolidated statements of cash flows, FY2021 Annual Report [13], FY2023 Annual Report [14] and FY2025 Annual Report [15].
Of the Rp24,005 billion collected across FY2021 to FY2025, Rp20,200 billion came in 2022, when Saratoga received Rp20,199,792 million from sales and withdrawals of investments and paid out Rp18,289,609 million for new ones [16]. The MD&A presents the receipt as a realisation: "In 2022, Saratoga sold some of its investments and earned more than IDR20,200 billion, in comparison with IDR443 billion in the previous year" [17].
The underlying transaction was a restructuring, disclosed as a material transaction worth 32.32% of the Company's equity: Wahana Anugerah Sejahtera sold Tower Bersama shares to Bersama Digital Infrastructure Asia, and Lynwood Hills subscribed for BDIA shares [18]. Both entities are Saratoga subsidiaries. Note 5 shows Rp21,208,296 million leaving the blue-chip book and Rp17,424,532 million entering it in the same year [19], and effective ownership of Tower Bersama moved from 34.23% to 26.69%, with 4.95% still held through Wahana Anugerah Sejahtera and the balance through a 29.64% interest in BDIA [20]. Management's own summary of the cash effect is narrower than the headline: "we also received IDR2.2 trillion from the divestment of 3% of our shareholding in PT Tower Bersama Infrastructure Tbk., as part of its successful restructuring into Digital Bersama Infrastructure Asia" [21]. The cash flow statement nets to Rp1,910 billion retained for the year.
That Rp1.9 trillion is close to what shareholders subsequently received: Rp809,836 million paid in 2022 and Rp1,013,638 million in 2023, Rp1,823 billion between them [22]. The largest realisation in Saratoga's listed history did reach the register. It was a recapitalisation of a stake the company still owns rather than a sale of it.
Disposal proceeds FY21-FY25 (Rp bn)
Cash deployed FY21-FY25 (Rp bn)
Dividends paid 2021-2026 (Rp bn)
Shares repurchased 2020-2025 (Rp bn)
Sources: derived from consolidated statements of cash flows, FY2021 [23], FY2023 [24] and FY2025 [25] Annual Reports; the June 2026 distribution is press-reported [26].
Excluding 2022, the four remaining years produced Rp3,805 billion of proceeds against Rp12,006 billion of deployment — a little over three rupiah invested for every rupiah realised. Deployment was funded in part by borrowing: Rp3,532,569 million of new bank loans was drawn in 2024 against Rp1,294,625 million repaid [27]. The direction has not changed in the current year: the first quarter of 2026 brought Rp197,251 million of proceeds against Rp97,259 million of purchases and a Rp156,000 million time-deposit placement [28].
The FY2025 report's own funnel shows 99 opportunities screened, 8 taken to preliminary assessment, 1 term sheet and no new investments at all, against Rp2,765 billion deployed [29]. The full year's capital went into positions Saratoga already owned.
What the exits fetched
Three separate disclosures bear on whether assets leave at their carrying value.
The clearest single case is Provident Investasi Bersama. Note 5 carried the 19.87% stake at Rp884,390 million at 31 December 2023 and shows no balance a year later [30]. The MD&A's fair-value adjustment table records a Rp389 billion loss on that position during 2024, against Rp14 billion the year before [31]. The position therefore left the balance sheet at roughly Rp495 billion, about 44% below the mark it carried entering the year. Growth-focused divestments in 2024 totalled Rp598,572 million across all disposals [32], which is consistent with that reading.
Second, the parent company's tax reconciliation carries a line for loss on sale of investments and derivative instruments, added back to accounting profit. It runs Rp3,430 million for 2023, Rp173,644 million for 2024 [33] and Rp90,801 million for 2025 [34] — Rp268 billion of realised losses in three years. Two limits apply. The line is the standalone Company reconciliation, so it excludes disposals made inside subsidiaries, which is where Provident Investasi Bersama sat. And it bundles derivatives with investments. The comparatives are also unstable: the FY2022 filing showed a Rp44,940 million gain for 2022 [35] where the FY2023 filing shows a Rp230,072 million loss, the Rp275,012 million difference having been reclassified out of the final-taxed income line [36]. The 2023 to 2025 figures are the ones that agree across filings.
Third, and quantitatively larger, part of the portfolio has left by markdown rather than by sale. Note 5's smallest two categories tell that story directly.
Sources: Note 5 summary of changes in fair values, FY2021 [37], FY2023 [38] and FY2025 [39] Annual Reports.
The digital technology book peaked at Rp525,293 million at the end of 2022 and stood at Rp51,621 million at the end of 2025 [40] [41]. Of the Rp240,092 million decline in 2025, Rp236,046 million was a fair-value change and only Rp4,046 million a divestment [42]. The Others category fell from Rp267,164 million at the end of 2020 to Rp604 million at the end of 2025 [43] [44]. Together those two buckets shed roughly Rp513 billion from their 2022 peak, almost none of it through a transaction. That is 2.4% of Saratoga's Rp21,432 billion market capitalisation at 31 December 2025 [45] — small against the portfolio, but it is the part of the book where a realisation record could most easily have been built, and it was not.
The disposals themselves are not itemised. In 2025 the cash statement shows Rp1,792,437 million received while note 5 removes Rp1,195,737 million of carrying value [46] [47], and no note reconciles the two or names what was sold. The cash-flow line is also labelled "proceeds from withdrawal of investments" in 2025, where in 2023 it read "sales/withdrawal" [48] [49]. Deal-level realisation evidence is thin enough that a definitive statement about whether Saratoga's marks are achievable in a sale cannot be made from this corpus.
Buybacks and treasury shares
The second route by which a holding company can convert a discount into value for continuing shareholders is repurchasing its own stock. Saratoga has spent Rp62.5 billion on treasury shares in six years: Rp56,317 million in 2020 [50], Rp985 million in 2022 and Rp5,204 million in 2023 [51], and nothing in 2021, 2024 or 2025 [52]. That is 0.29% of the same Rp21,432 billion market capitalisation at 31 December 2025, cumulative.
The holding is also shrinking rather than growing. Treasury stock stood at 15,002,100 shares carried at Rp9,833 million at 31 December 2025, down from 20,307,100 shares at Rp13,310 million a year earlier, the difference distributed to employees under the long-term incentive programme, whose authorisations and mechanics sit in Pay and Alignment [53]. The remaining balance is 0.11% of issued capital [54]. The buyback authority in force serves compensation, not the discount. No corpus document discusses repurchasing shares to narrow the gap to net asset value.
The company also confirms that the 2013 IPO proceeds are fully spent and that it conducted no public offering of equity or debt securities during 2025 [55]. Whatever the record says about returning capital, it says nothing about diluting shareholders to raise it.
Reading it, and what would change it
The evidence points to a company that compounds inside the portfolio rather than one that harvests it. No divestment from the four core holdings since the listing; a five-year record in which deployment ran to Rp12,006 billion against Rp3,805 billion realised once the 2022 restructuring is set aside; a growth book whose weakest positions were written down rather than sold; and a treasury account that funds pay rather than shrinking the share count. On that record, the gap between price and net asset value has no scheduled mechanism for closing, and the reasonable base case is that it closes only if the marks themselves rise or the dividend keeps stepping up.
The strongest fact against that read is the 2022 sequence. When a genuine realisation of scale did occur, the cash was not retained: Rp1,823 billion went out as dividends across the following two payment years, close to the Rp1,910 billion the year netted [56]. The June 2026 distribution of about Rp1,401 billion followed a year in which borrowings fell to Rp1,451 billion [57] [58]. The pattern is not that realised cash gets trapped; it is that realisations are rare.
Three observable things would change the read. A sale of any part of a core holding to a third party at or near the marked price, with the proceeds distributed rather than redeployed — the marks and the willingness to convert them would both be tested at once. A treasury programme sized in the hundreds of billions of rupiah rather than tens, bought at a discount to net asset value. Or an initial public offering of an unlisted position — Brawijaya Healthcare is the largest — which would move value from a Level 3 estimate to an observable price and give the growth book its first realisation of scale. None of these has been announced in any corpus document.
Web research was unavailable throughout this run: the search provider returned an insufficient-credit error on retry for this chapter, as it did for the three before it. No post-March-2026 disclosure, broker commentary or transaction report could be checked, so the absence of a recent divestment announcement is an absence in this corpus rather than established fact.
What the boardroom costs
Saratoga's five commissioners and three directors were paid Rp34,813 million in 2025 — 5.8 basis points of the Rp60,284 billion net asset value they oversee, and a figure that has stayed inside a narrow band for six years [1][2]. Almost none of it is equity. The long-term incentive plan transfers shares to directors at the market close on the day, so cash is effectively the whole of board pay, and the founder's 35.9% direct stake carries the alignment.
What the eight of them receive
The annual report publishes the remuneration of the Board of Commissioners and Board of Directors as a single combined figure split four ways. In 2025 that was Rp18,955 million of salary and holiday allowance, Rp11,910 million of bonus, Rp3,948 million of allowances and facilities, and Rp3,839,000 — three point eight million rupiah — under the heading "Long Term Incentive Program (Shares)" [3]. The four components sum to Rp34,817 million, which reconciles to within Rp4 million of the Rp34,813 million the audited related-party note reports as key management personnel compensation [4]. The same reconciliation holds in each of the four prior years, which is why the governance disclosure can be treated as the audited number decomposed rather than a separate presentation.
Sources: the combined BoC and BoD remuneration tables in the FY2025 [5], FY2024 [6], FY2023 [7], FY2022 [8] and FY2021 [9] annual reports. The share-based component is omitted from the chart because at Rp1.5–4.2 million a year it is not visible at this scale.
The audited series runs Rp34,700 million (2020), Rp32,271 million (2021), Rp34,825 million (2022), Rp41,633 million (2023), Rp34,416 million (2024) and Rp34,813 million (2025) [10][11][12]. Over six years the bill is 0.3% higher in nominal rupiah, against a portfolio that grew 76%, from Rp34,507 billion to Rp60,768 billion over the same period [13][14].
The bill against the assets
An eight-person board and a 67-person company sit on top of a portfolio the company values at Rp60,284 billion [15][16]. Expressed against that base, the board's pay has not exceeded 8.5 basis points since 2021, and it only reached that level in 2023 because net asset value fell 20% while remuneration rose 20%.
Sources: remuneration per the governance disclosures cited above and the audited related-party notes [17]; net asset value per the company's own NAV tables — FY2025 [18], FY2023 [19], FY2021 [20]; basis points derived.
Board pay is one line inside a wider cost base. Total operating expenses were Rp232,558 million in 2025, of which employees' salaries and other compensation were Rp130,595 million and share-based payments Rp8,972 million [21]. Total personnel cost of Rp139,567 million across 67 employees averages Rp2,083 million a head; the eight board members average Rp4,352 million and take a quarter of the personnel bill.
The arithmetic matters because cost drag is one of the standard explanations for a holding-company discount, and here it does not carry much weight. Capitalising the entire Rp232,558 million cost base in perpetuity at a 10% discount rate gives Rp2,326 billion, or 3.9% of net asset value; at 8% it is 4.8%. Board pay alone, capitalised the same way, is Rp348 billion — 0.6% of NAV. Against a gap between the Rp4,444 NAV per share at 31 December 2025 and the Rp1,760 close on 27 July 2026, the manager's cost explains something like four or five points of roughly sixty. A reader looking for the source of the discount will not find much of it here.
A third-party manager charging a 1.5% base fee on Rp60,284 billion of assets would bill Rp904 billion a year before any carry, which is 3.9 times Saratoga's entire corporate cost base of Rp232.6 billion and 26 times the Rp34.8 billion its eight named board members cost.
The variable part
Bonus is the component that moves most. It ran Rp14,646 million (2021), Rp15,729 million (2022), Rp18,970 million (2023), Rp10,732 million (2024) and Rp11,910 million (2025) — from 45% of total pay in the first three years to 31% and 34% in the last two [22][23][24][25][26].
The bonus does not track net asset value per share in the same year, and it points the wrong way: the largest bonus of the five, Rp18,970 million, was paid in the year NAV per share fell 19.8%, and the smallest, Rp10,732 million, in a year it rose 10.5%. On a one-year lag, with bonuses paid in year N rewarding year N−1, the fit improves in one place and fails in another. The 43% cut in 2024 does follow the 2023 drawdown, which is the clearest signal in the series. But the peak bonus of 2023 followed a year in which NAV per share rose 8.2%, while 2021's 78% gain was followed by the second-smallest bonus in the set. Neither reading produces a stable relationship.
The company describes the input rather than the formula. Director remuneration "takes into account the Company's financial and operational performance, achievement against approved budgets and business targets, and benchmarking against the industry peers" [27]. No metric, weighting, threshold or peer group is named, and no deferral or clawback was applied in 2025 [28]. Independent commissioners receive no bonus component at all, which the company states is to preserve their independence [29].
The measured read is that the bonus is discretionary rather than formulaic, sized by a committee against unpublished judgements, and that its one visible response to performance was to fall by nearly half after the worst year in the company's listed history. Publication of a metric, or of the split between the commissioners and the directors, would settle it; neither exists in any filing in the corpus.
An incentive plan the directors pay for
The long-term incentive programme reads like equity compensation and behaves like a mandated share purchase. On 1 July 2025 the three executive directors took 1,463,800 shares between them — Michael W.P. Soeryadjaya 182,300, Lany Djuwita Wong 595,900, Devin Wirawan 685,600 — at an exercise price of Rp1,575 [30]. On 1 July 2024 they took 1,982,400 shares at Rp1,480 [31]. On 1 July 2026 they took 1,860,200 shares at Rp1,560, spending close to Rp3 billion of their own money [32]. The Indonesia Stock Exchange closed at Rp1,560 on 1 July 2026: the exercise price is the market price on the day.
That mechanic is why the "Long Term Incentive Program (Shares)" line in the remuneration table is Rp3,839,000 against Rp2,305 million of shares changing hands. Almost no value is transferred at grant, because the directors pay for the shares. The accounting agrees: the consolidated share-based payment charge was Rp8,972 million in 2025, of which the board's share is 0.04% [33][34]. Essentially all of the equity value in the plan goes to the 64 people below board level.
The charge itself is shrinking while the plan grows. Successive board resolutions allocated 6,242,000 shares to the 2022–2025 programme, 13,247,000 to 2023–2026, 13,902,000 to 2024–2027 and 14,605,000 to 2025–2028, half time-vested and half performance-vested [35]. Over the same period the share-based expense fell from Rp45,533 million (2022) to Rp34,904 million (2023) [36], Rp18,625 million (2024) [37] and Rp8,972 million (2025) [38]. More shares are being promised and less value is being booked, because the grant-date fair value per share falls as the share price falls. A plan whose cost declines as the discount widens is a weak instrument for closing the discount.
Sources: LTIP allocations from Note 1d of the FY2025 Annual Report [39]; share-based payment charges from the operating expense notes of the FY2023 [40], FY2024 [41] and FY2025 [42] Annual Reports.
The plan also has a supply constraint. It is funded from treasury stock, and the June 2025 extraordinary meeting authorised only 5,500,000 treasury shares for distribution during the year [43]. With 15,002,100 shares left in treasury [44] and roughly five million going out a year, the pool supports about three more years at the current rate. That is one identified mechanical reason the company might have to buy stock again, and a different motive from the discount arbitrage examined in Realisation Record.
Who sets the number
The general meeting votes only on a cap for the commissioners. The 25 June 2025 annual meeting set the maximum aggregate remuneration for all commissioners at Rp17,000,000,000 and delegated to those same commissioners the authority to set the directors' salaries, bonuses and allowances [45]. The cap has been Rp17 billion since 2023 and was Rp15 billion in 2021 and 2022 [46][47][48]. Because only the aggregate is published, the split between the two boards is undisclosed: the directors' share of the Rp34,813 million lies somewhere between Rp17,813 million and the full total, depending on how much of the cap the commissioners drew.
The recommendation comes from a three-member Nomination and Remuneration Committee chaired by an independent commissioner, with the other two seats held by the president commissioner and a senior manager who reports to the board of directors whose pay is being set [49]. Those seats were held at 31 December 2025 by Aria Kanaka as chairman, Edwin Soeryadjaya and Handianto Ganis [50]. Edwin Soeryadjaya is the president commissioner, the controlling shareholder and the ultimate beneficial owner, and is affiliated with both the commissioner Joyce Soeryadjaya Kerr and the president director Michael W.P. Soeryadjaya [51][52]. One of the three votes on directors' pay therefore belongs to the father of the president director [53].
The remuneration resolution passed with 12,397,567,662 shares in favour (99.69%), 6,629,688 against (0.05%) and 30,847,900 abstaining, on a register where three parties hold 89% [54]. On a register that concentrated, the result follows from the ownership rather than from any assessment of the pay, which is the inference the arithmetic supports: the vote is a weak check on remuneration. At the same meeting the articles of association were amended so that directors and commissioners now serve until the close of the fifth annual general meeting [55] rather than the third [56], and the boards were reappointed for 2025–2030 [57][58]. Both long-serving independent commissioners, Sidharta Utama and Anangga W. Roosdiono, stepped down at that meeting and were replaced by Aria Kanaka and Stephanus Harjanto T [59]. Two of five commissioners are independent; both are new, and the reset happened in the same resolution that lengthened everyone's term.
One further delegation is worth recording because it governs the activity that actually determines net asset value. The Investment Committee is empowered to make investment and divestment decisions up to 10% of the company's equity without escalation [60]. On the Rp58,919 billion of consolidated equity at 31 December 2025 that is roughly Rp5,892 billion a transaction, or about US$351 million at the year-end mid rate of Rp16,782 [61][62] — roughly two to three and a half times the US$100–150 million of annual new investment management says it targets [63]. Its four members are Edwin Soeryadjaya as supervisor, Michael W.P. Soeryadjaya as chairman, and the two other directors; it met four times in 2025 with full attendance, and no independent commissioner sits on it [64].
Where the exposure actually sits
The pay disclosure describes a low-cost, cash-paid, discretionary arrangement over which minority holders have no vote. What makes it tolerable is not the design but the ownership.
Edwin Soeryadjaya held 4,865,971,990 shares directly at 31 December 2025, 35.872% of the company, plus a disclosed indirect interest of 2,242,824,635 shares [65]. His direct stake alone is worth Rp21,624 billion at the 31 December 2025 net asset value of Rp4,444 per share and Rp8,564 billion at the Rp1,760 close of 27 July 2026. The Rp13,060 billion difference is his personal share of the discount — 375 times the entire annual boardroom pay bill. The FY2025 dividend of Rp103.3 per share paid him roughly Rp503 billion in June 2026 [66], more than fourteen times what all eight board members earned in a year. Whatever is wrong with the incentive structure, it is not that the controlling shareholder who sits on the remuneration committee is indifferent to the share price.
Founder's Share of the Discount (Rp bn)
Annual BoC + BoD Pay (Rp m)
Three Directors' Combined Stake (Rp m)
Sources: shareholdings from the FY2025 Annual Report, Shareholder Information [67]; remuneration from Note 15 [68]; values derived at the Rp4,444 net asset value per share at 31 December 2025 [69] and the Rp1,760 market close of 27 July 2026 as reported.
He has also been buying. His direct holding rose by 8,504,400 shares during 2025 [70], including 960,000 shares on 16 July 2025 and a further 1.56 million on 12 August 2025, and he added 1.53 million more at an average Rp1,618.5 in early February 2026 [71].
Two facts cut against that reading.
The first is that the control block was a net seller in 2025. PT Unitras Pertama's holding fell from 4,438,610,000 to 4,289,610,000 shares — 149,000,000 shares, 1.1% of capital — while Edwin Soeryadjaya added 8,504,400, leaving the three principals down 140,495,600 shares on the year and the public float up from 9.96% to 10.995% [72][73]. That happened in the year the discount to published NAV widened to its five-year worst, and in a year the company itself bought back nothing. The disclosure does not let an outsider attribute the sale cleanly: the two Soeryadjaya commissioners' combined indirect interest fell by 74,500,000 shares, exactly half the Unitras disposal, and the two indirect figures exceed Unitras' own registered holding — by 29,425,215 shares at 1 January 2025 and by 103,925,215 at 31 December 2025 [74]. No price, counterparty or purpose is stated anywhere in the corpus.
The second is that the hired management has very little at stake. Michael W.P. Soeryadjaya, Lany Djuwita Wong and Devin Wirawan held 19,682,300 shares between them at 31 December 2025 — 0.145% of the company, worth about Rp34,641 million at Rp1,760 [75]. That is almost exactly one year of combined board pay. For the two directors who are not family, the annual salary is the dominant economic relationship with the company, and the incentive plan asks them to convert part of it back into stock at market price each July rather than granting them upside.
The related-party record supports the low-extraction reading rather than complicating it. The governance code prohibits personal loans to commissioners, directors and director-level executives [76], and none appears in Note 15. The Rp731,256 million related-party balance at 31 December 2025 is Rp704,605 million of declared but unpaid dividends from the Adaro-complex entities and Rp26,651 million owed by PT Mulia Gunung Mas, on which Rp16,351 million of interest was recognised [77]. The external audit fee was Rp4,650,000,000 in 2025 with Rp108,500,000 of non-audit work, a ratio that raises no independence question [78].
What would change the read
The evidence points to a board that is cheap, unusually stable in cost, and owned into the outcome at the top — and to a pay process that a minority holder cannot influence, cannot decompose between the two boards, and cannot tie to any published metric. On the numbers, extraction is not where the value is leaking: a sixty-point discount is not accounted for by a cost base worth about four points of net asset value once capitalised, of which board pay is roughly half a point.
Three things would move the assessment. A disclosed split between commissioner and director remuneration, with a stated performance metric, would convert a discretionary arrangement into a testable one. A repeat of the 2025 pattern — the control block selling into a widening discount while the company declines to repurchase — would suggest the family's revealed preference is liquidity rather than value, and would matter far more than the pay line. And a bonus that returns to Rp19 billion in a year net asset value per share falls again would settle the question the 2024 cut left open.
All figures in Indonesian rupiah as reported. No external research beyond the filing corpus was available for this chapter, so neither the PT Unitras Pertama disposal price nor peer holding-company remuneration could be confirmed outside the documents cited above.
Return Without Re-rating
From the end of 2021, Saratoga's net asset value per share compounded at 2.8% a year while a shareholder lost 11.4% a year. From the end of 2020 the same two figures are 14.8% and 20.4%. In both cases the difference is the discount, not the portfolio. This chapter prices what a holder earns if the discount never moves again, and finds the distribution decision worth up to 5.8 points a year of it — a distribution funded out of two coal holdings. Alamtri and Adaro Andalan are 28.0% of Saratoga's Rp60,768 billion portfolio but supplied Rp2,149 billion, 79.4%, of the Rp2,705 billion of FY2025 dividend income out of which the roughly Rp1,401 billion FY2025 distribution was paid — and because every Rp100 of dividend per share is worth 3.43 percentage points of annual holder return at an unchanged price-to-net-asset ratio, about 2.8 of the 3.5 points that the Rp103.3 payout is worth traces to coal dividends, while Tower Bersama and Merdeka Copper Gold, 48% of the portfolio, supplied 8% and nothing respectively [1][2][3].
What is paying the 3.5 points?
Held constant, the discount is not a drag on a holder's forward return; it is a multiplier on the distribution. At Rp1,760 against the Rp4,444 of net asset value published for 31 December 2025, one divided by the price less one divided by net asset value per share is 3.43 percentage points of annual return for every Rp100 of dividend per share [4][5]; the identity and the grid it produces are set out below. What the multiplier is applied to is the dividend, and the dividend has a narrow base.
The sensitivity carries into the same grid in the same units. On 13,564,835,000 shares [6], every Rp500 billion of dividend income that does not arrive is Rp37 a share of distributable cash, and at 3.43 points per Rp100 that is about 1.3 points a year of holder return. Alamtri's payment has already halved once, from Rp3,121 billion in 2024 to Rp1,515 billion in 2025 [7]; a second fall of that size, Rp1,606 billion, is worth roughly 4 points a year, against the 5.2% the grid's four-year-portfolio-rate row shows on the current dividend. The Rp2,294 billion of recurring cash income that anchors the grid's widest column is the same exposure at full stretch: Rp2,149 billion of the Rp2,705 billion received in 2025 came from the two coal names [8][9].
Two facts cut against reading that split as fixed. Adaro Andalan's first payment after the thermal-coal separation, Rp634 billion, took the coal share of dividend income from 82.4% in 2024 to 79.4% in 2025 with no action by the company. And Tower Bersama's Rp225 billion in 2025 followed Rp363 billion in 2024, so its 8% contribution is a low base rather than a ceiling [10][11].
What the last five years paid
Two things can be measured across the same period: what the portfolio did per share, and what an owner of the shares actually collected. They are not the same number.
Saratoga publishes net asset value per share back to 2002, restated for the 2021 five-for-one split. The series runs Rp1,440 (2016), Rp1,648, Rp1,163, Rp1,685, Rp2,337, Rp4,152, Rp4,492, Rp3,601, Rp3,971 and Rp4,444 at the end of 2025 [12][13]. The 2024 figure was published as Rp3,980 in the 2024 report and appears as Rp3,971 in the 2025 one; the arithmetic below uses the figure each year's own report carried.
The share price over the same window: Rp686 at the end of 2020, then Rp2,800, Rp2,530, Rp1,640, Rp2,090 and Rp1,580 [14][15][16]. Dividends paid in each of those years, split-adjusted, were Rp22, Rp60, Rp75, Rp22 and Rp14.75 [17][18][19][20].
Sources: derived from net asset value per share [21][22], year-end closing prices [23][24][25] and dividends paid [26][27]; each series reinvests the dividend at its own value.
The shape matters more than the endpoints. The green line quadruples in a single year — 2021 — and then falls for four of the next five periods. The blue line rises in four years out of five and never doubles. An owner who bought at the end of 2020 beat the portfolio by fifty-four points of cumulative return; an owner who bought a year later trailed it by fifty. The two owners held the same assets under the same management, twelve months apart.
Where the return came from
A holder's return in any year comes from three places: what the portfolio did per share, the dividend measured against the price paid, and the change in the ratio of price to net asset value. The first two are what an investor thinks they are buying. The third has been the largest of the three in four of the five years since 2020; in 2023 it was a close second to a 19.8% fall in net asset value per share.
Source: derived from the net asset value per share series [28][29], year-end closes [30][31][32] and dividends paid [33][34][35][36]; the three components compound rather than add.
In 2025 the portfolio added 11.7% per share and the shareholder lost 23.7%, because the price-to-net-asset ratio fell by nearly a third. In 2024 the portfolio added 10.5% and the shareholder made 28.8%, because the ratio rose by 15%. The income column never exceeded 3.2 points in any of the five years: on the pre-2026 payout, the dividend was not a material part of the answer.
The 2026 part-year runs the other way. Rp103.3 a share was paid on 12 June [37] and the shares closed at Rp1,760 on 27 July [38], a total return of 17.9% from the Rp1,580 close, of which 6.5 points is the dividend — more income in seven months than in any of the previous five years.
Over a longer frame the two measures separate further. Net asset value per share was Rp1,311 at the end of 2013, the year of listing, against Rp4,444 at the end of 2025 — 10.7% a year for twelve years [39]. The shares were sold in the June 2013 offering at Rp5,500, or Rp1,100 after the 2021 split [40]; at Rp1,760 that is 3.7% a year over thirteen years before dividends. The corpus carries the dividends paid from 2020 onward — Rp308 a share across seven payment years — but not those for 2014 to 2019, so a complete since-listing total return cannot be built here. All of these figures are in rupiah; the currency's depreciation over the period is a further deduction for a dollar-based holder, and sits in Inside the Portfolio.
Return when the gap does not move
Every chapter before this one has examined why the gap exists. None has priced what happens if it simply stays. That is the more useful question for a buyer at Rp1,760, because it is the case that requires nothing to go right.
The arithmetic is exact and short. If the ratio of price to net asset value is unchanged from one year to the next, a holder's return is the portfolio's own return on net assets plus the dividend per share multiplied by the difference between one divided by the price and one divided by net asset value per share. At Rp1,760 against the Rp4,444 published at 31 December 2025 [41], that difference works out at 3.43 percentage points for every Rp100 of annual dividend per share.
Held constant, the discount works entirely through the distribution. A rupiah of net asset value paid out arrives in the holder's hand as a rupiah; the same rupiah left inside is capitalised by the market at Rp0.40. Every rupiah distributed moves about Rp0.60 of value across that boundary, and nothing about the portfolio has to change for it to happen.
Source: derived from the Rp1,760 close of 27 July 2026 [42], published net asset value per share of Rp4,444 [43], the 2025 and 2026 dividends [44][45] and the 2025 consolidated statement of cash flows [46]; annual holder return at an unchanged price-to-net-asset ratio.
Each row is anchored to a rate in the record. Zero is the case where the marks go nowhere. 1.7% is what net asset value per share actually compounded at over the four years from the end of 2021. 10.7% is the twelve-year rate since listing. 6.0% sits between them. The columns are the FY2024 dividend of Rp14.75, the FY2025 dividend of Rp103.3, and Rp169 — the whole of the Rp2,294 billion of recurring cash income the holding company collected in 2025, built line by line in Cash Income and Estimates [47].
Two readings sit in that grid. On the four-year portfolio rate and the current dividend, a holder earns about 5.2% a year with the discount frozen — below the 5.45% to 7.88% Saratoga itself pays on its rupiah bank borrowings [48]. On the twelve-year rate and full distribution of recurring cash, the same holder earns 16.5%. The 11.3 points between those two cells are what the portfolio does and what the board decides to send out, with the discount held fixed in both.
What the distribution decision is worth
Distributing the entire Rp2,294 billion of 2025 recurring cash income rather than none of it moves roughly Rp1,386 billion of market value to shareholders at the current ratio — Rp102 a share, 5.8% of the price, recurring annually. It is also entirely discretionary: the stated dividend policy specifies no ratio, only that distributions require sufficient profits or positive retained earnings and must respect liquidity, capital adequacy and future investment requirements [49], and the company sets formal annual targets only for operating expenses [50].
The same arithmetic settles a question left open by Realisation Record. At a fixed price-to-net-asset ratio, a buyback and a dividend deliver almost exactly the same value. Spending Rp103.3 a share retiring stock at Rp1,760 lifts net asset value per share from Rp4,444 to Rp4,611, worth Rp1,826 at the same 39.6% of net assets; paying it as a dividend leaves Rp1,719 of share plus Rp103.3 of cash, or Rp1,822, four rupiah apart. Saratoga has bought back nothing in either 2024 or 2025, distributing 5,305,000 and 8,031,900 treasury shares to employees instead [51], but the Rp1,401 billion it did distribute in June 2026 captured what a buyback of the same size would have captured. The choice of instrument is worth four rupiah a share; the amount distributed carries the rest.
The strongest fact against reading all of this as a case for maximum distribution is that the company has a use for the money and says so. Management targets US$100 million to US$150 million of new investment a year [52]. Deployment ran Rp2,765 billion in 2025 against Rp5,772 billion in 2024 [53]. Capital deployed at cost and marked at cost converts into Rp0.40 of share price on day one, so it has to compound to roughly two and a half times its outlay before it matches a rupiah simply handed over — but that is a demand for a good return, not an argument that no return is available. The judgement here is that the payout is worth more to a holder than the deployment record supports, and it would change if a deployment produced a realisation above its carrying value; the record of realisations sits in Realisation Record.
The second counter-fact is that the discount has never actually been constant. It ran 70.6% at the end of 2020, 32.6% a year later and 64.4% at the end of 2025 [54][55][56]. A frozen ratio is a modelling convenience that has never held for two consecutive years. It is used here because it isolates what the holder earns without needing the market to change its mind — and because, as the decomposition table shows, movement in that ratio has swamped everything else in both directions.
What would move the answer
Each of these is checkable in a specific document, against a specific prior figure.
Dividends received in the 2026 cash flow statement. Rp2,510 billion in 2025, down from Rp4,247 billion [57]. This line sets the ceiling on any repeat of the Rp1,401 billion distribution without recourse to disposals or borrowing.
The anchor the 2027 meeting uses. The May 2026 resolution set the payout at 19.13% of a reported profit of Rp7.32 trillion [58], a profit that was mostly fair-value gain. A percentage of dividends received and a percentage of reported profit give very different answers in a year when the marks fall, and 2023 was such a year.
Purchases of investments in the cash flow statement. Rp2,765 billion in 2025, Rp5,772 billion in 2024 [59]. A return to the 2024 rate alongside a maintained dividend means new borrowing, as it did in 2024 when Rp3,533 billion was drawn.
Any treasury purchase beyond incentive-plan replenishment. Fifteen million shares remain in treasury against roughly five million distributed a year [60]. A purchase larger than that requirement would be the first time the discount is used rather than described.
A named entry in the divestment row of the Investment Milestones chart. The chart opens every annual report [61] and, on the count in Realisation Record, names nine exits in thirteen listed years and none at all for 2025. A realisation above carrying value would raise the portfolio-return row of the grid and narrow the ratio at the same time.
The register. PT Unitras Pertama held 4,289,610,000 shares, 31.62%, at 31 December 2025 [62] against 4,438,610,000 a year earlier [63]. Further sales from the 89% block enlarge the float; they also supply stock into a thin market.