PT Saratoga Investama Sedaya Tbk's management explains the business in its own materials. The slides below do the most of that work, pulled from the documents preserved in Sources. Each source link opens the complete presentation at that slide in a new tab.
Saratoga's own company-overview deck and the fastest route from zero to understanding: what it owns, how it deploys and recycles capital, and how NAV is built. · Open the full document →
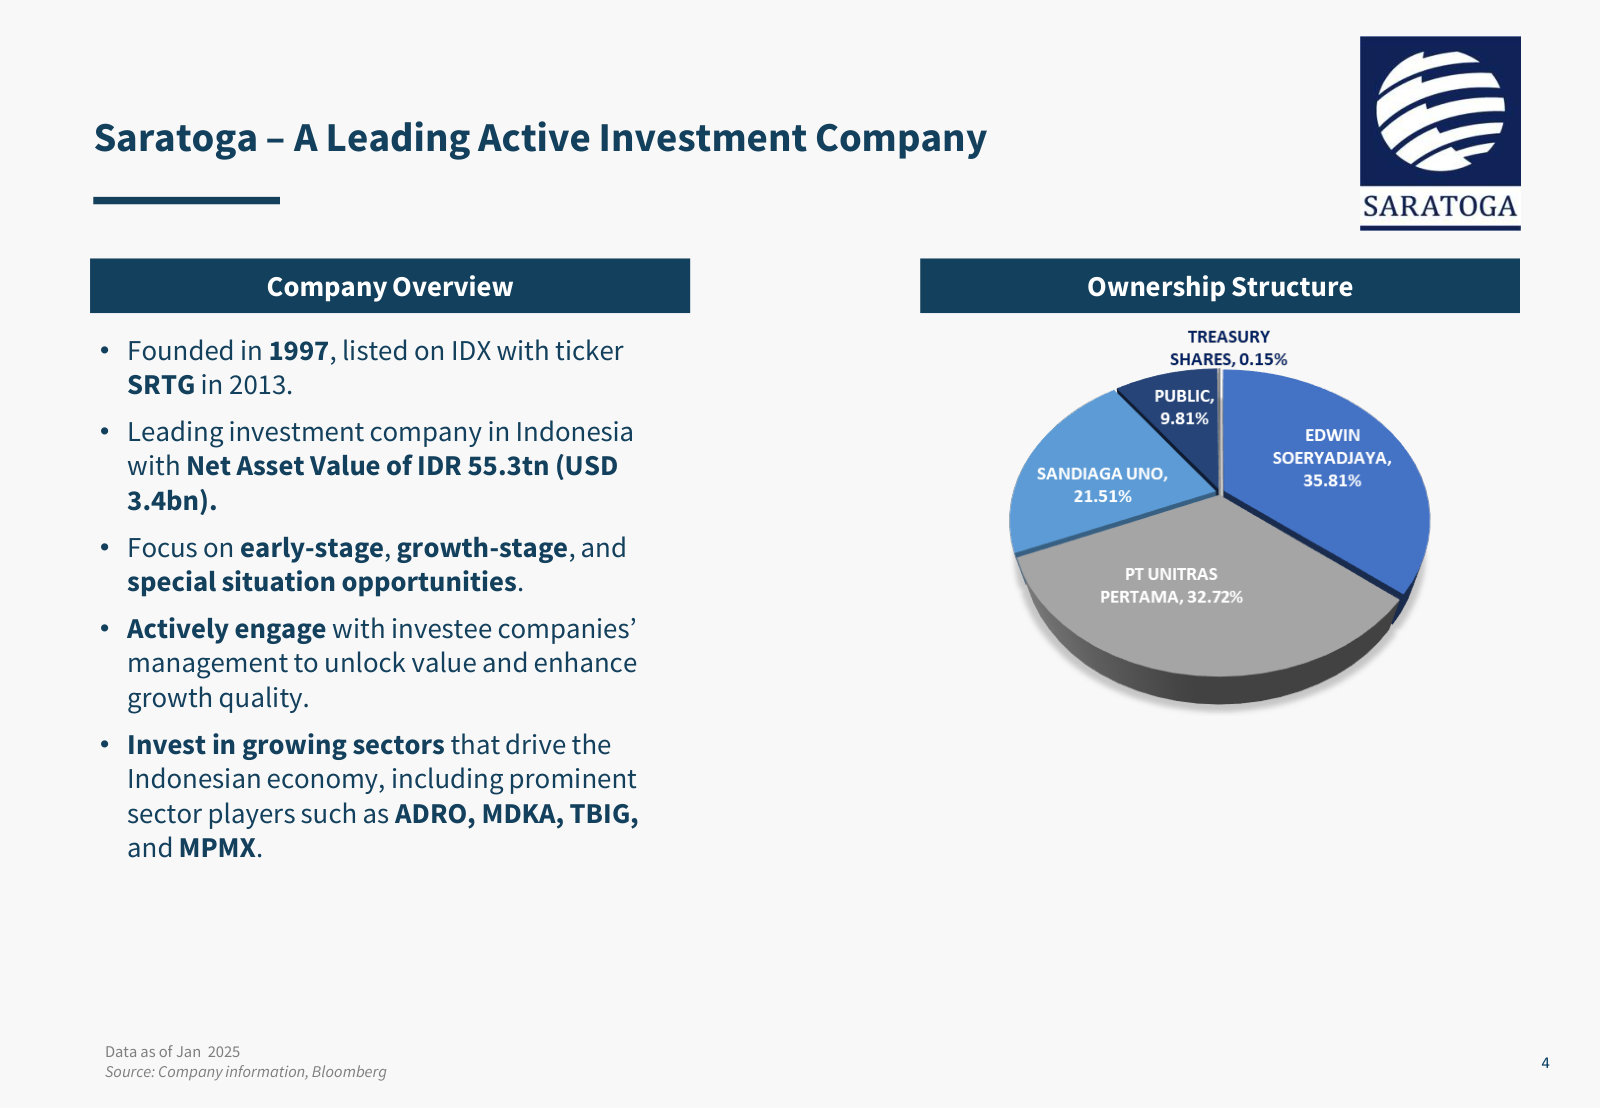
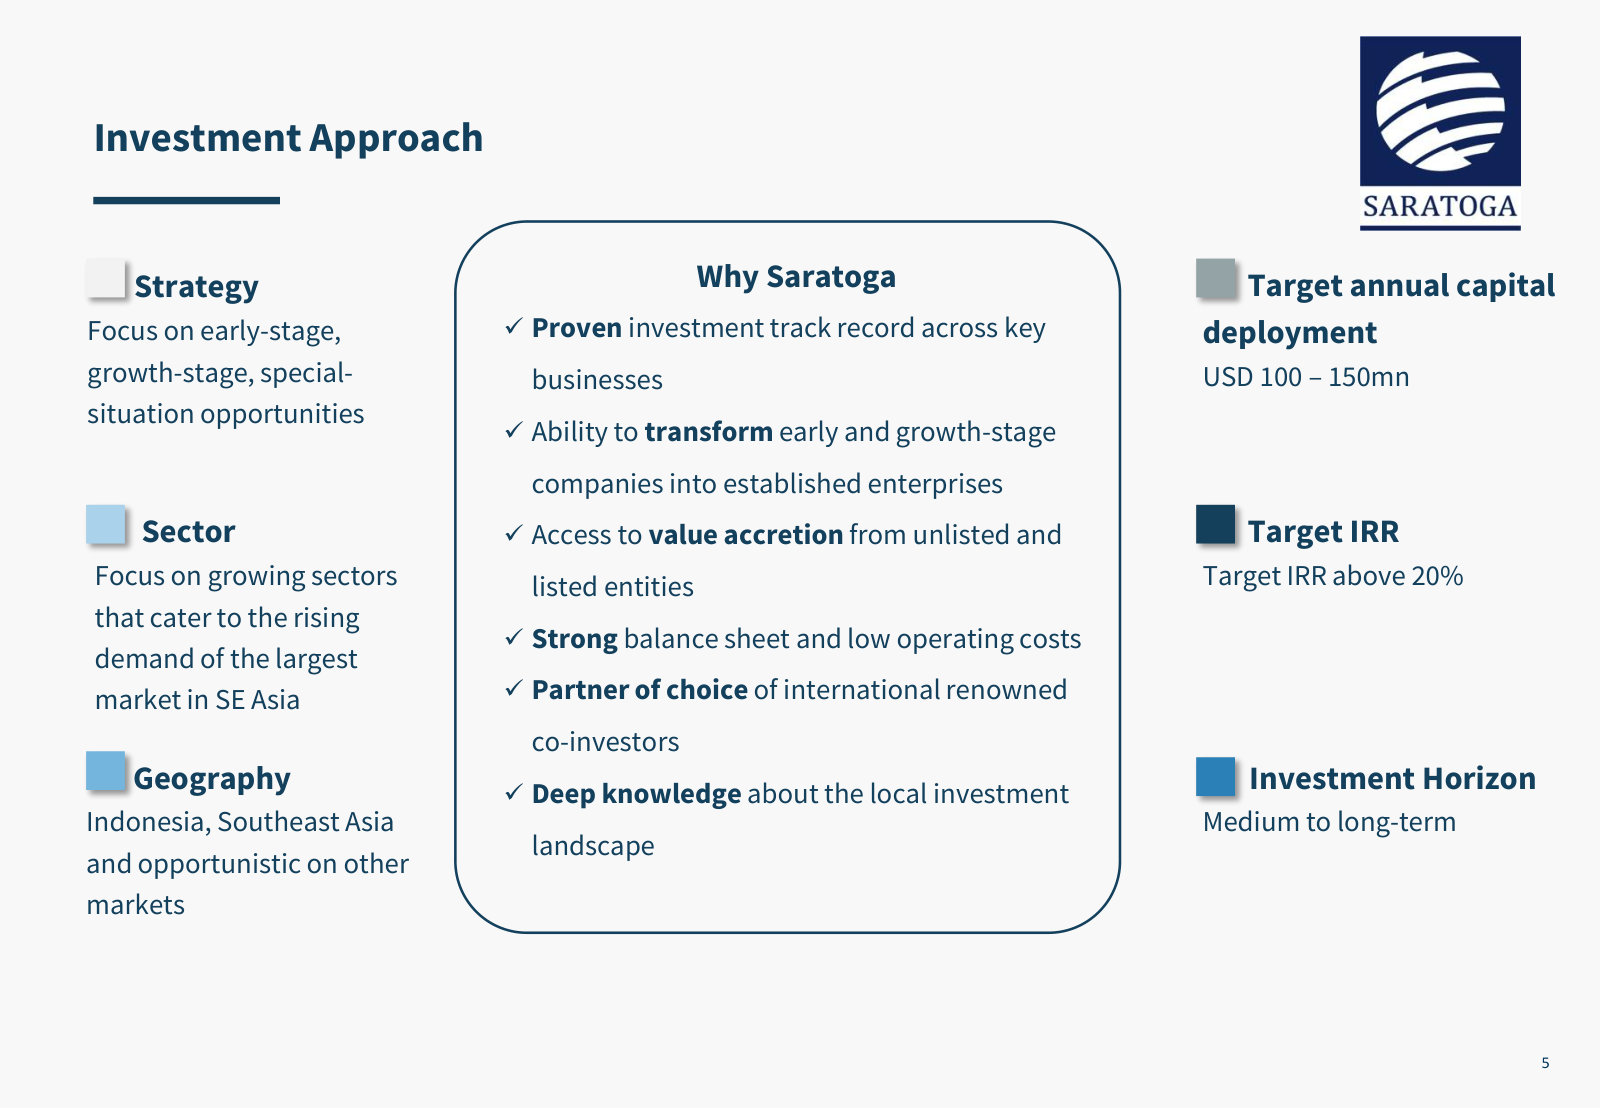
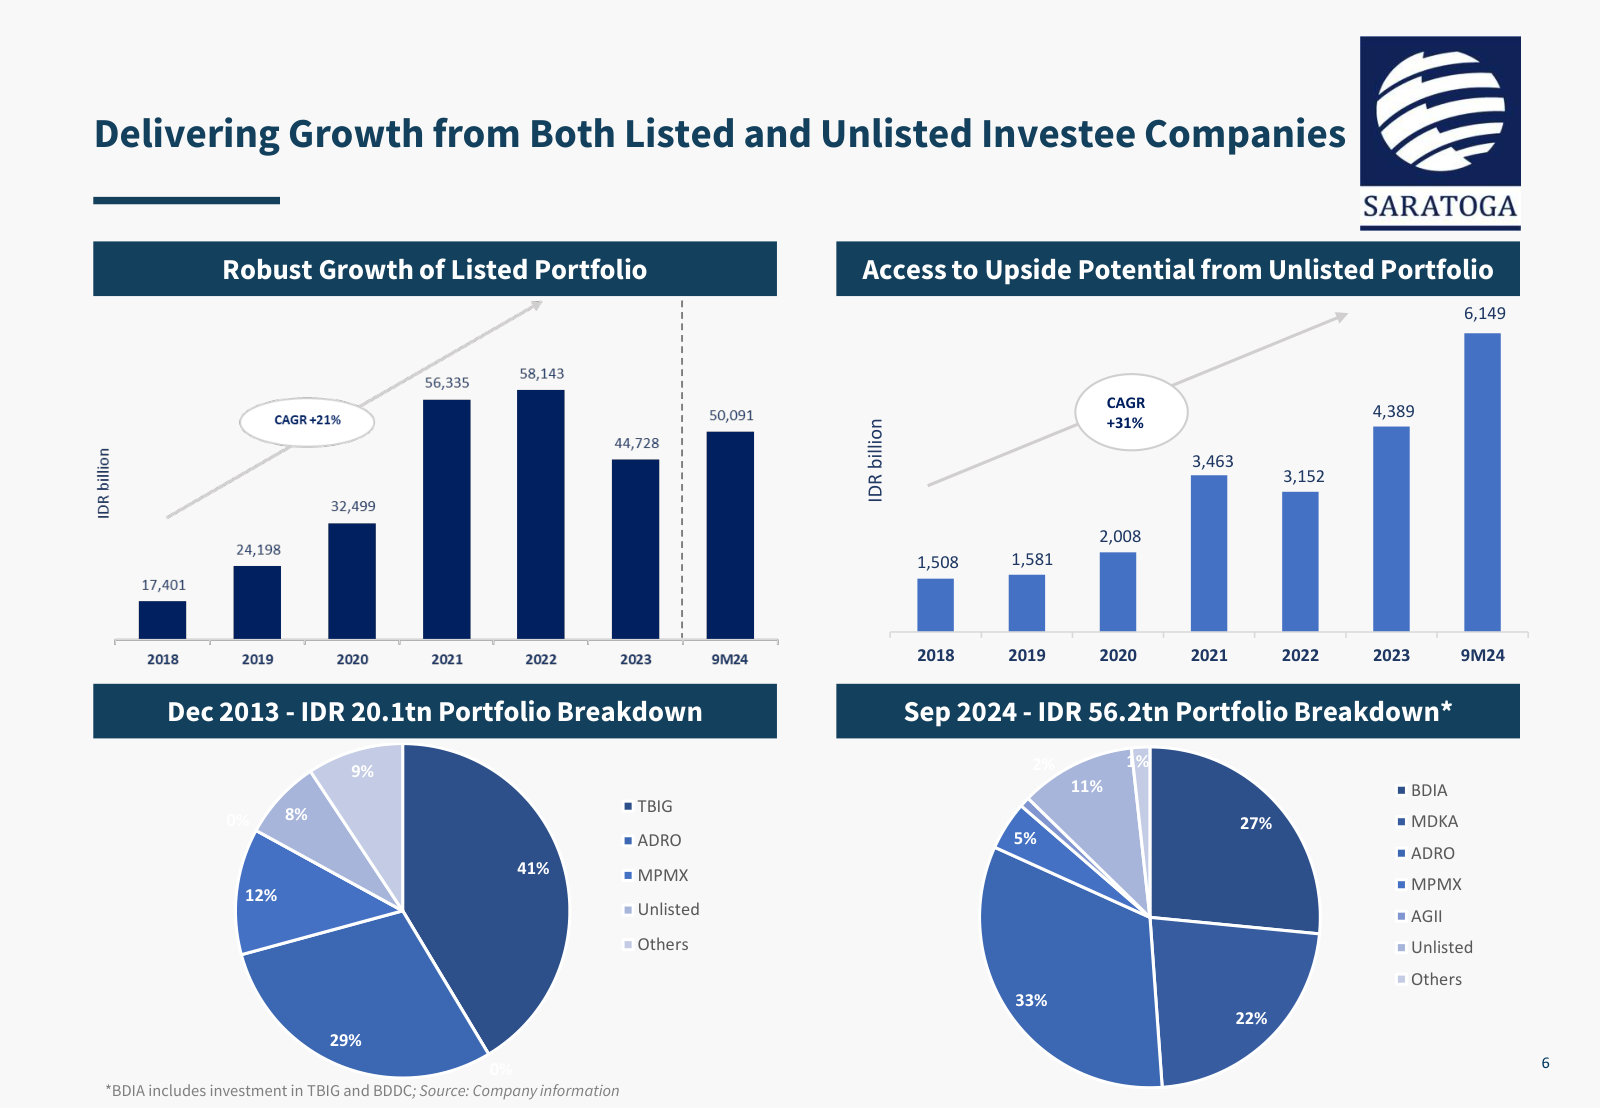
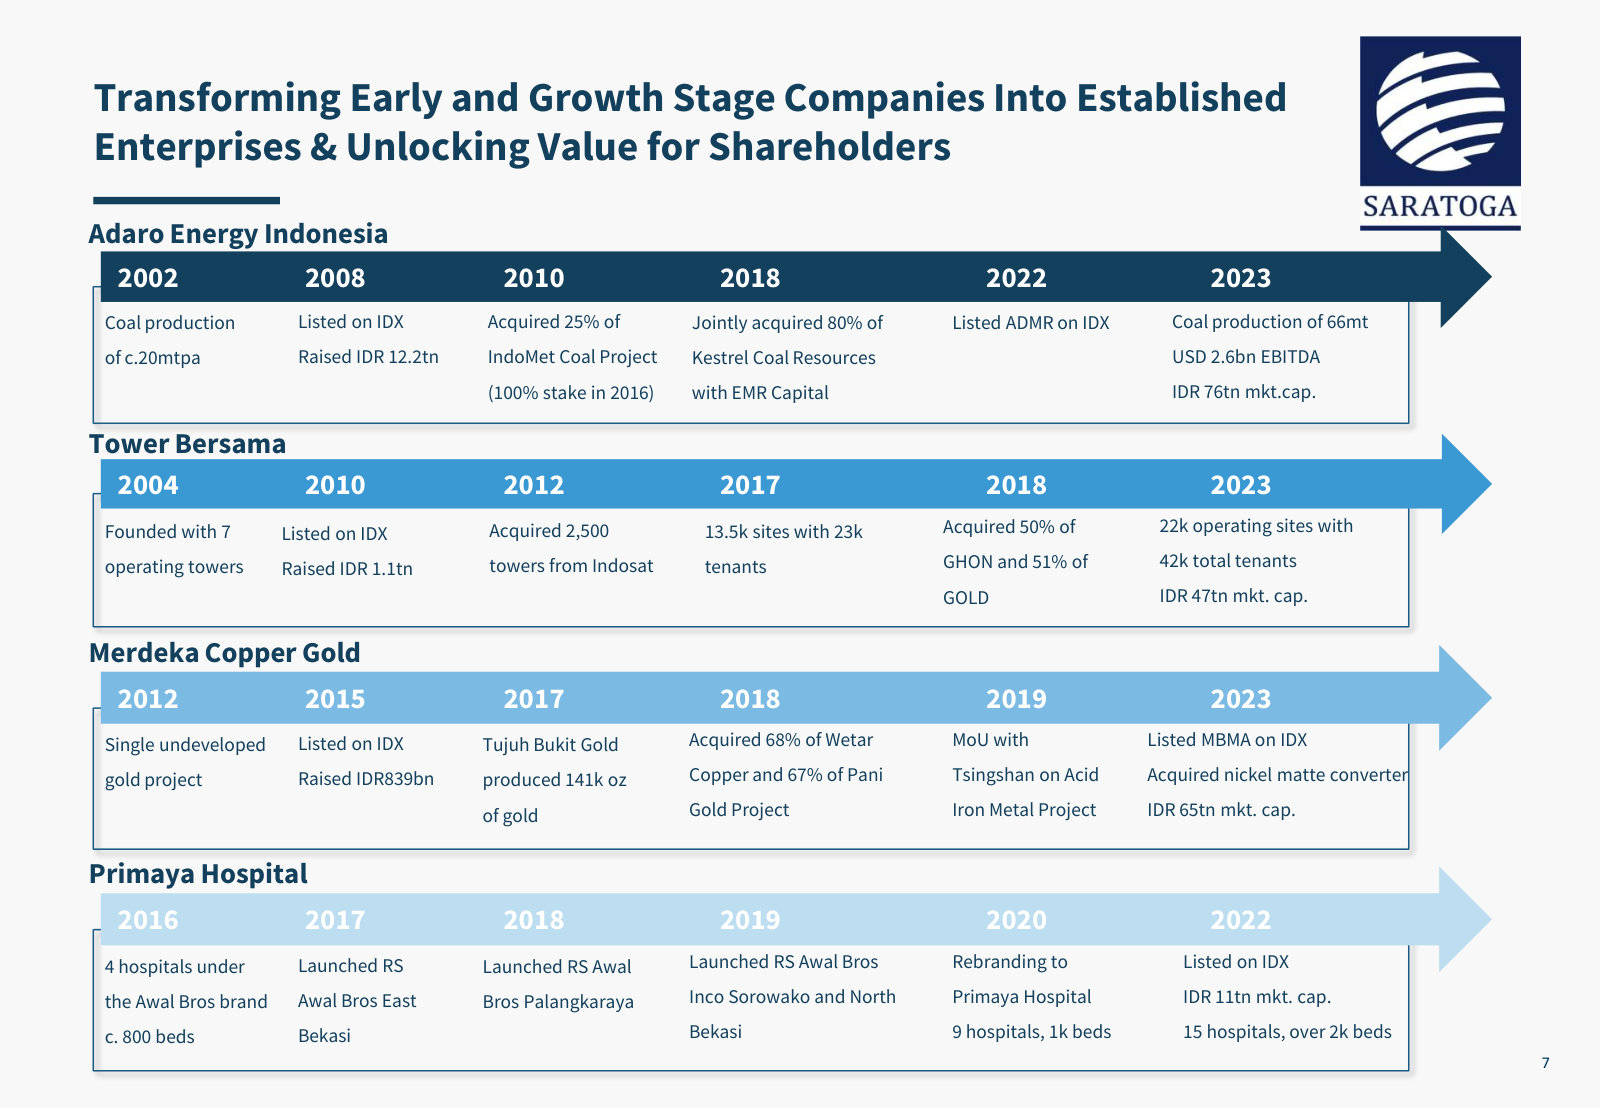
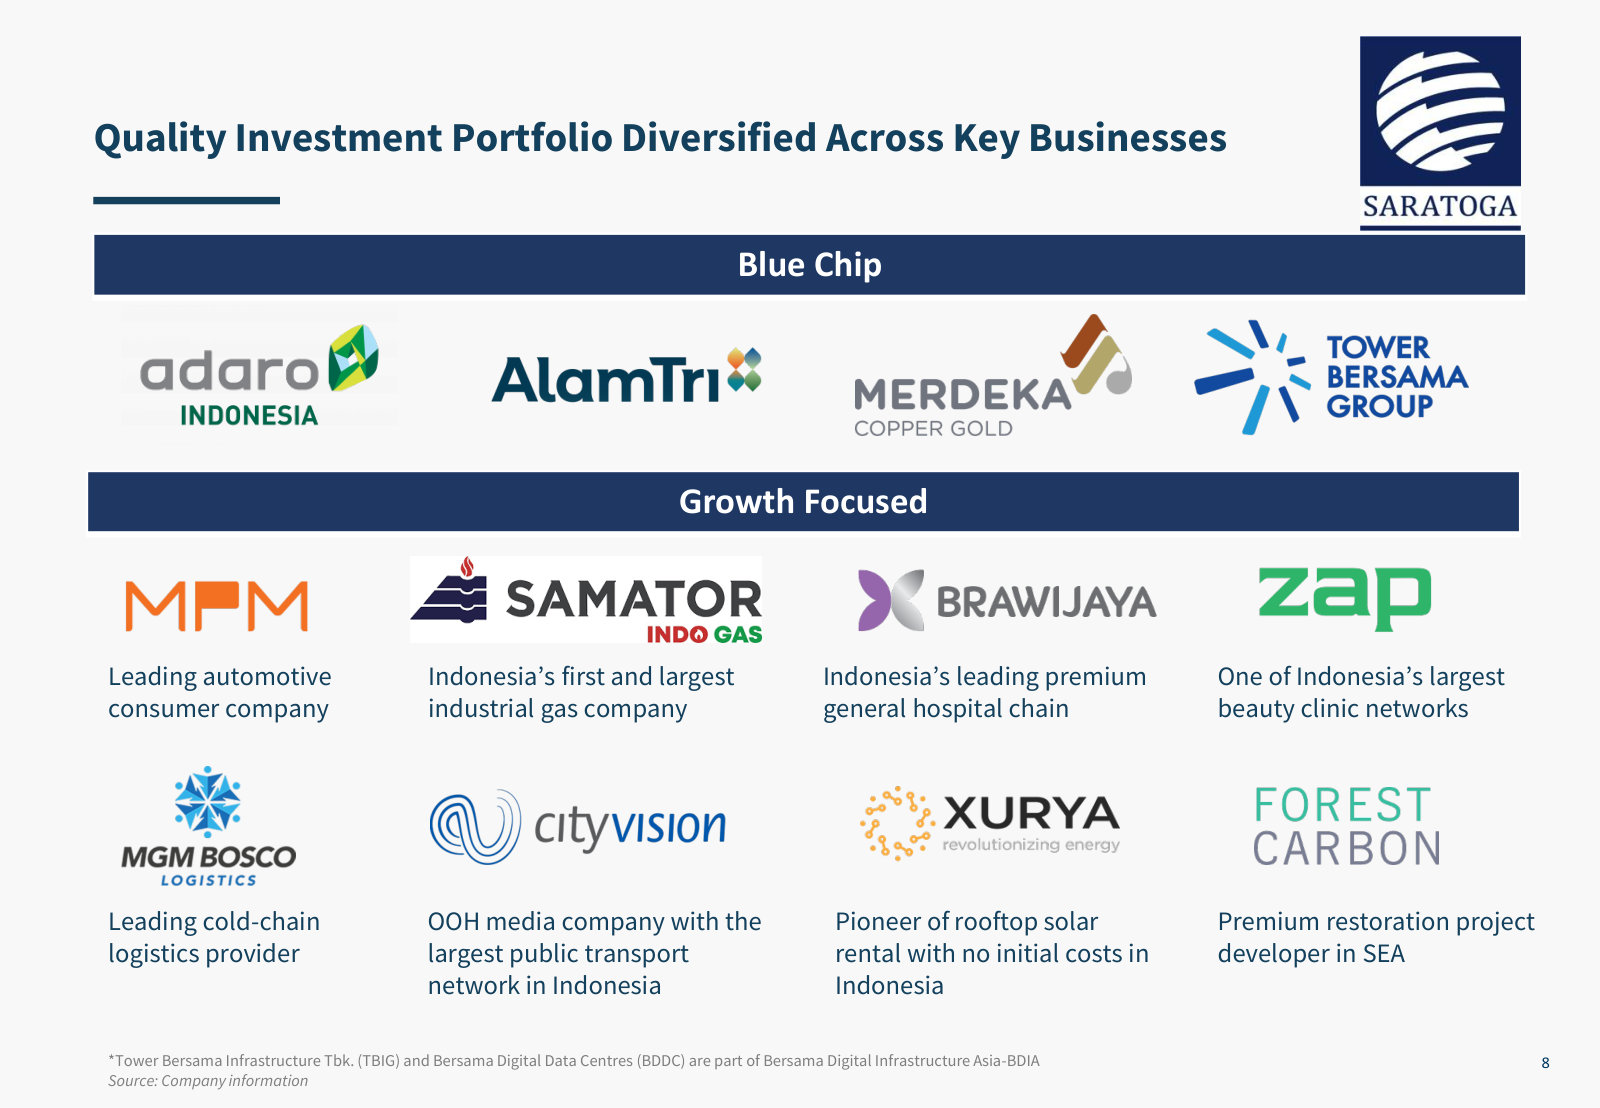
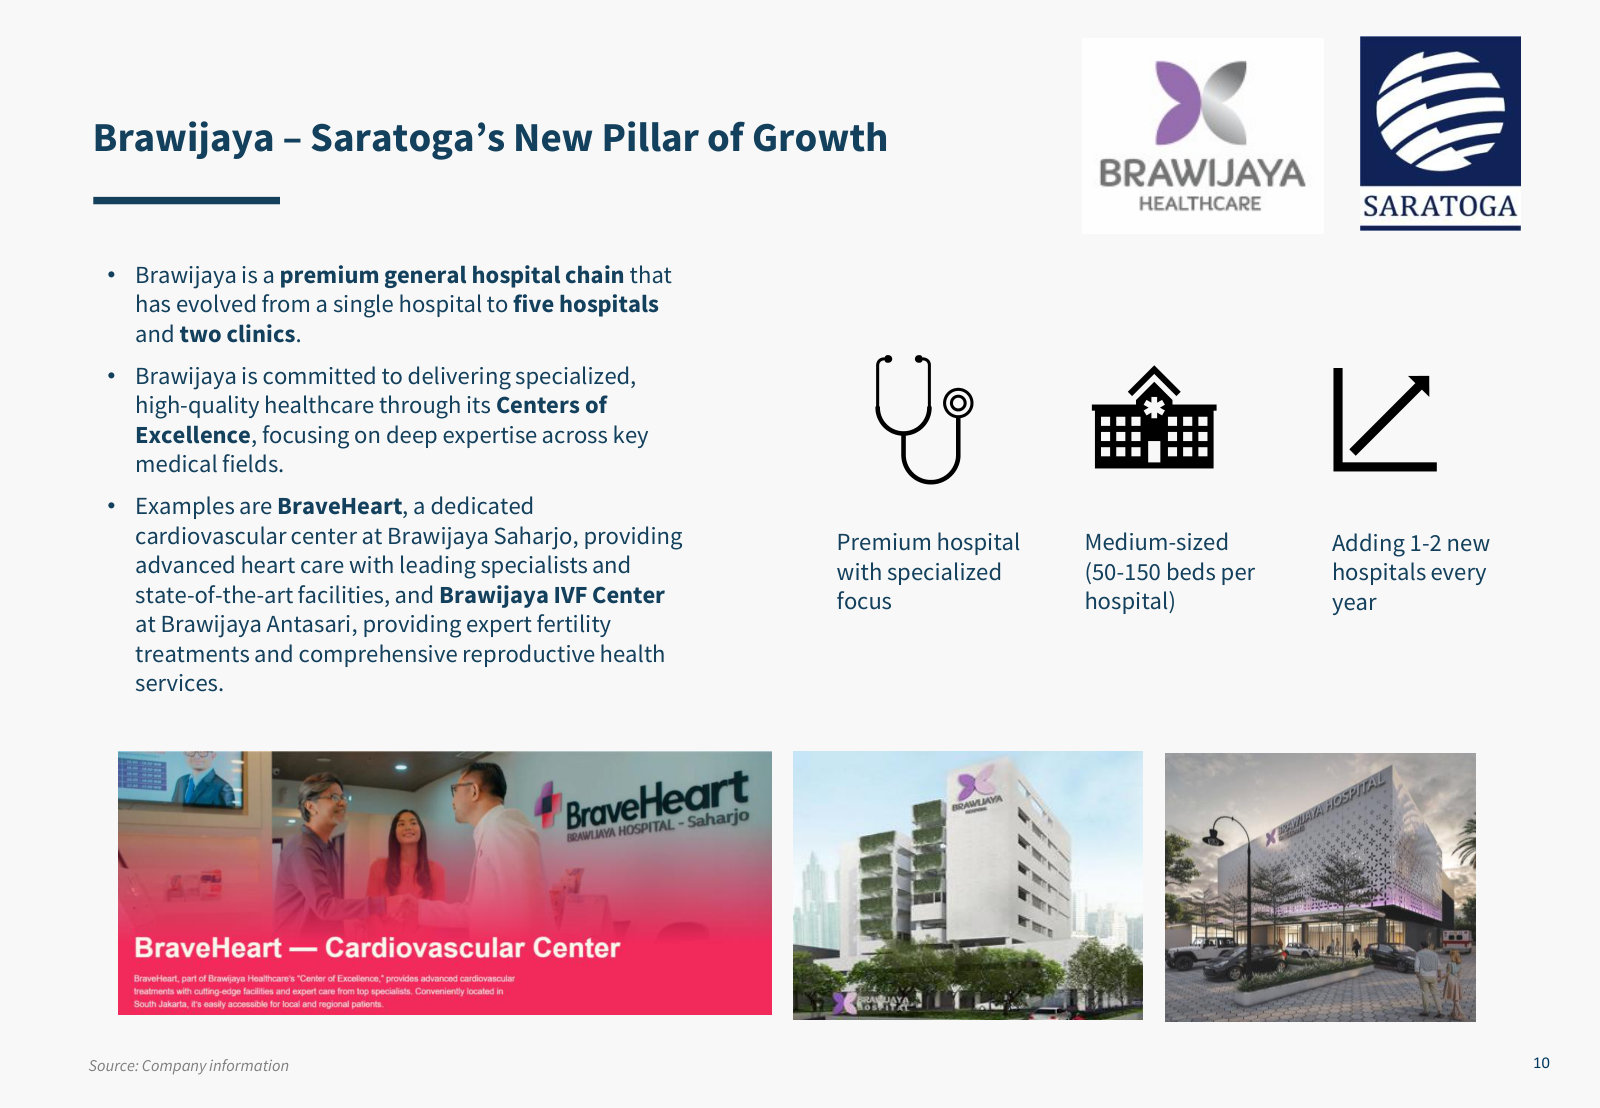
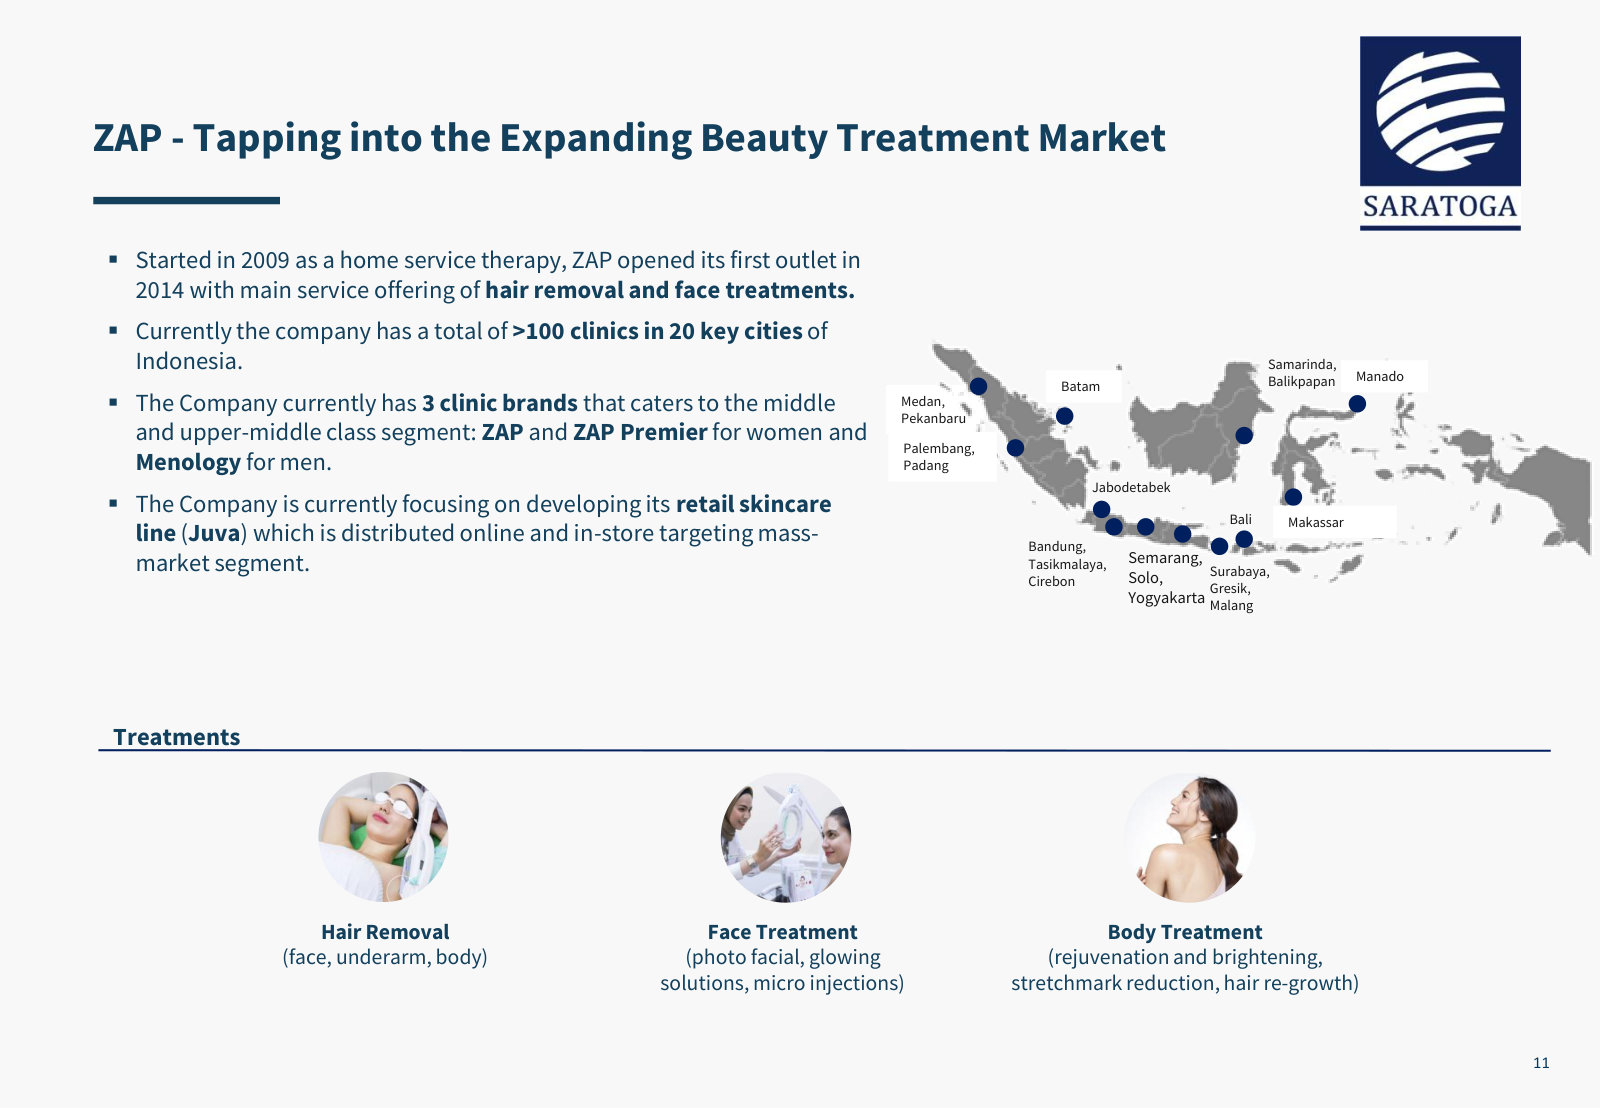
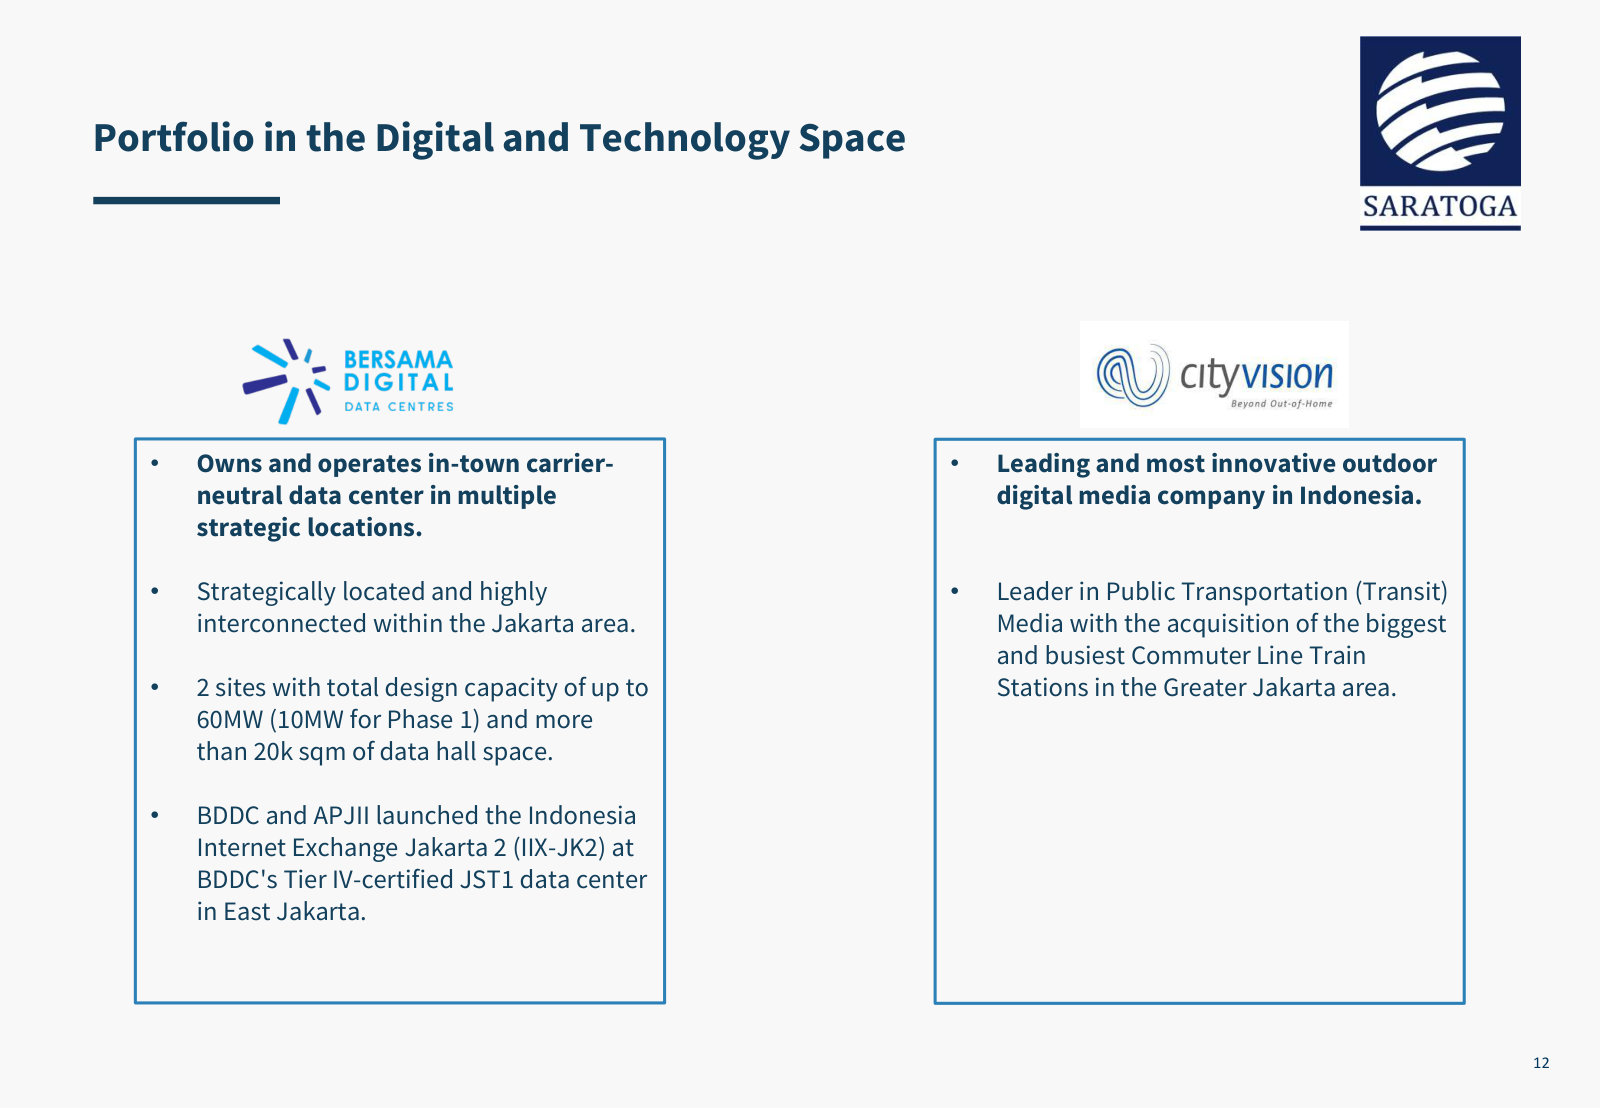
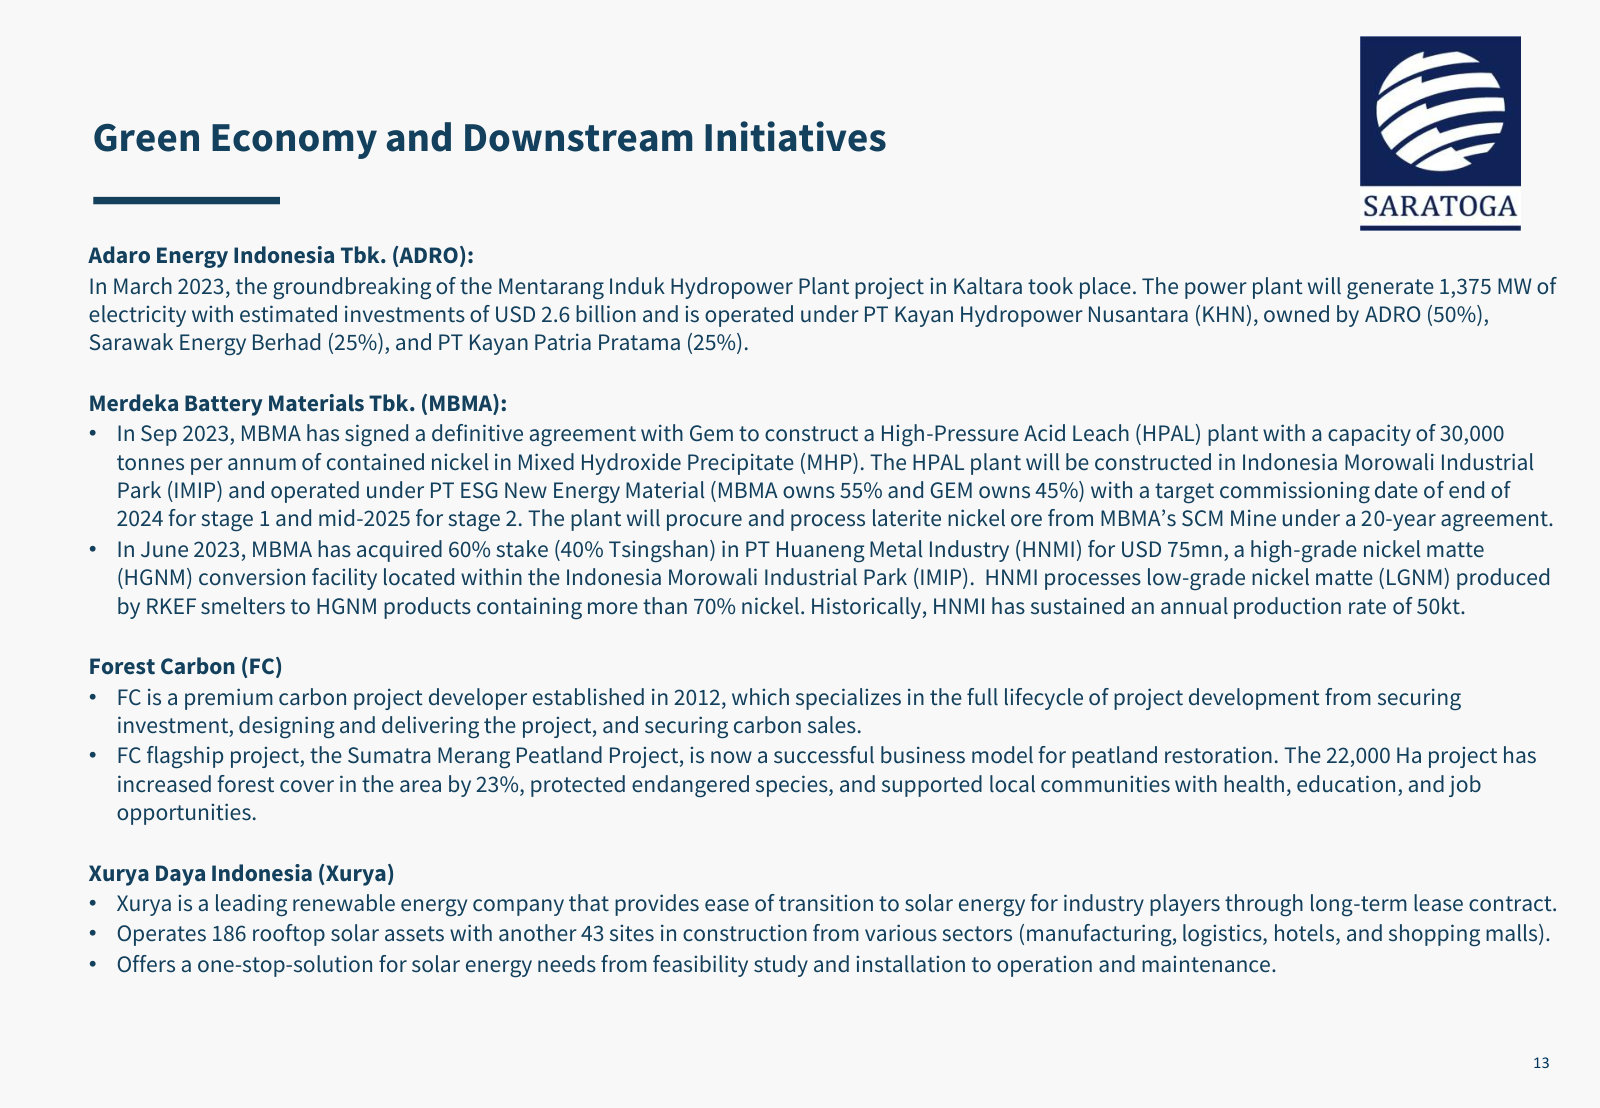
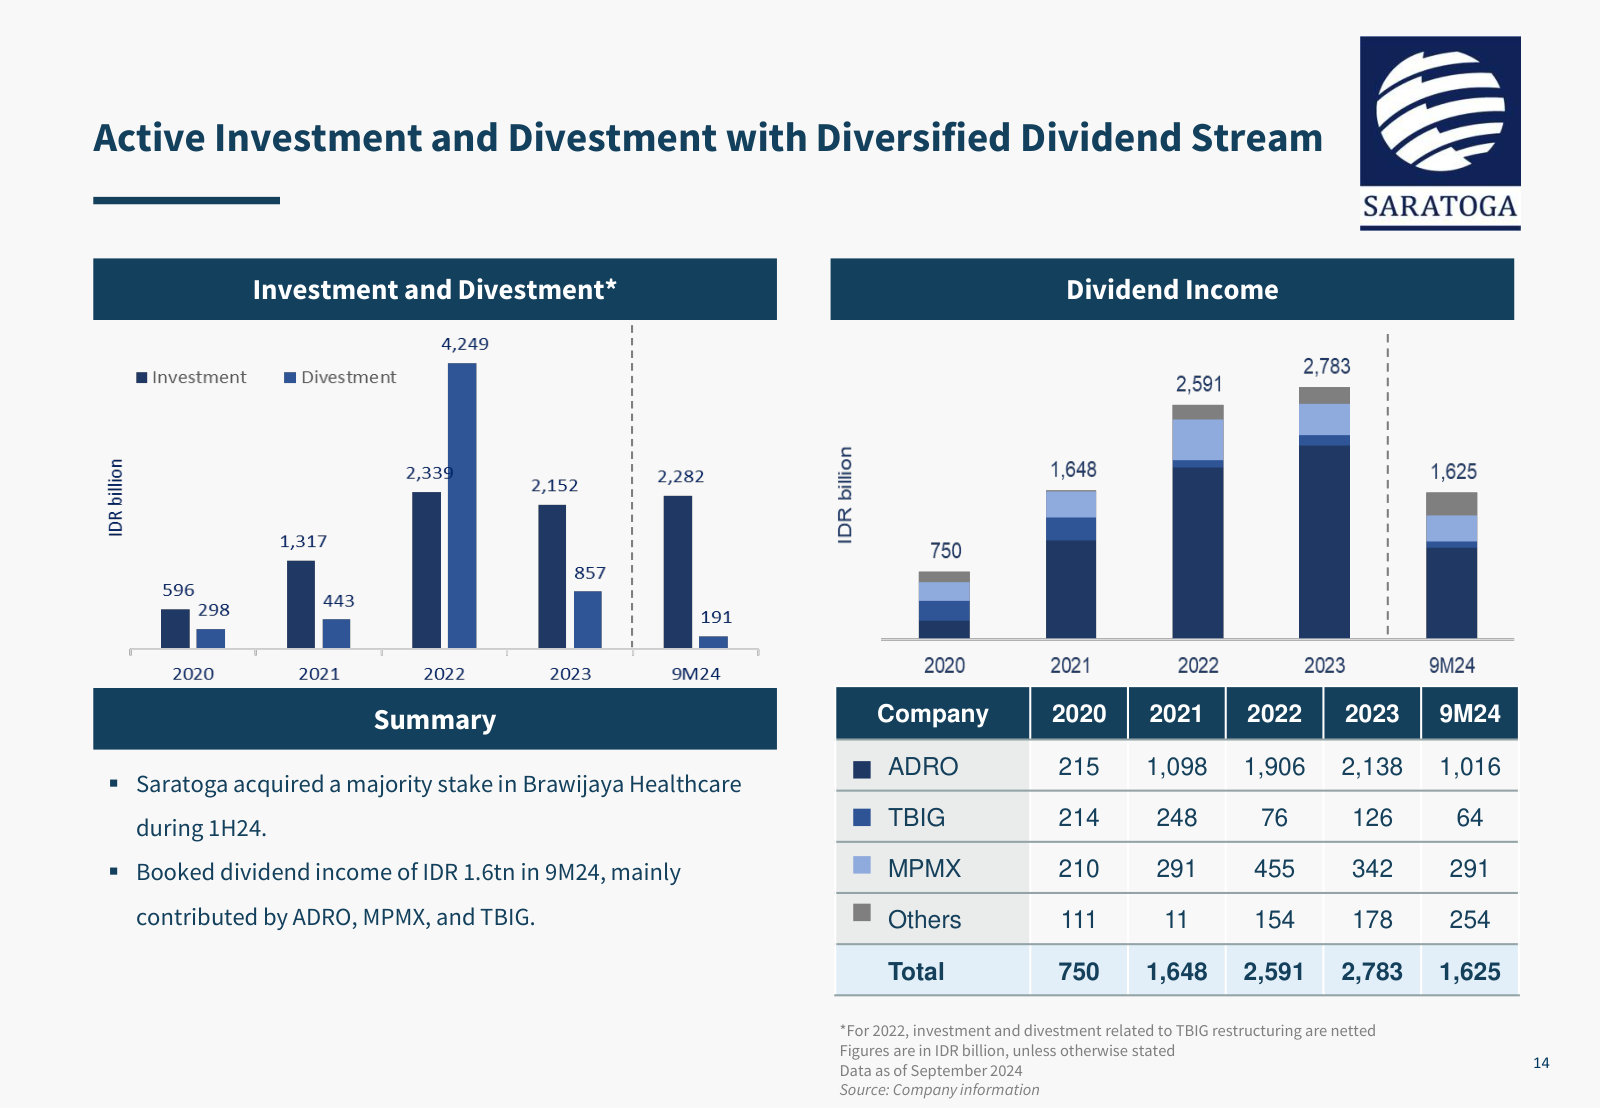
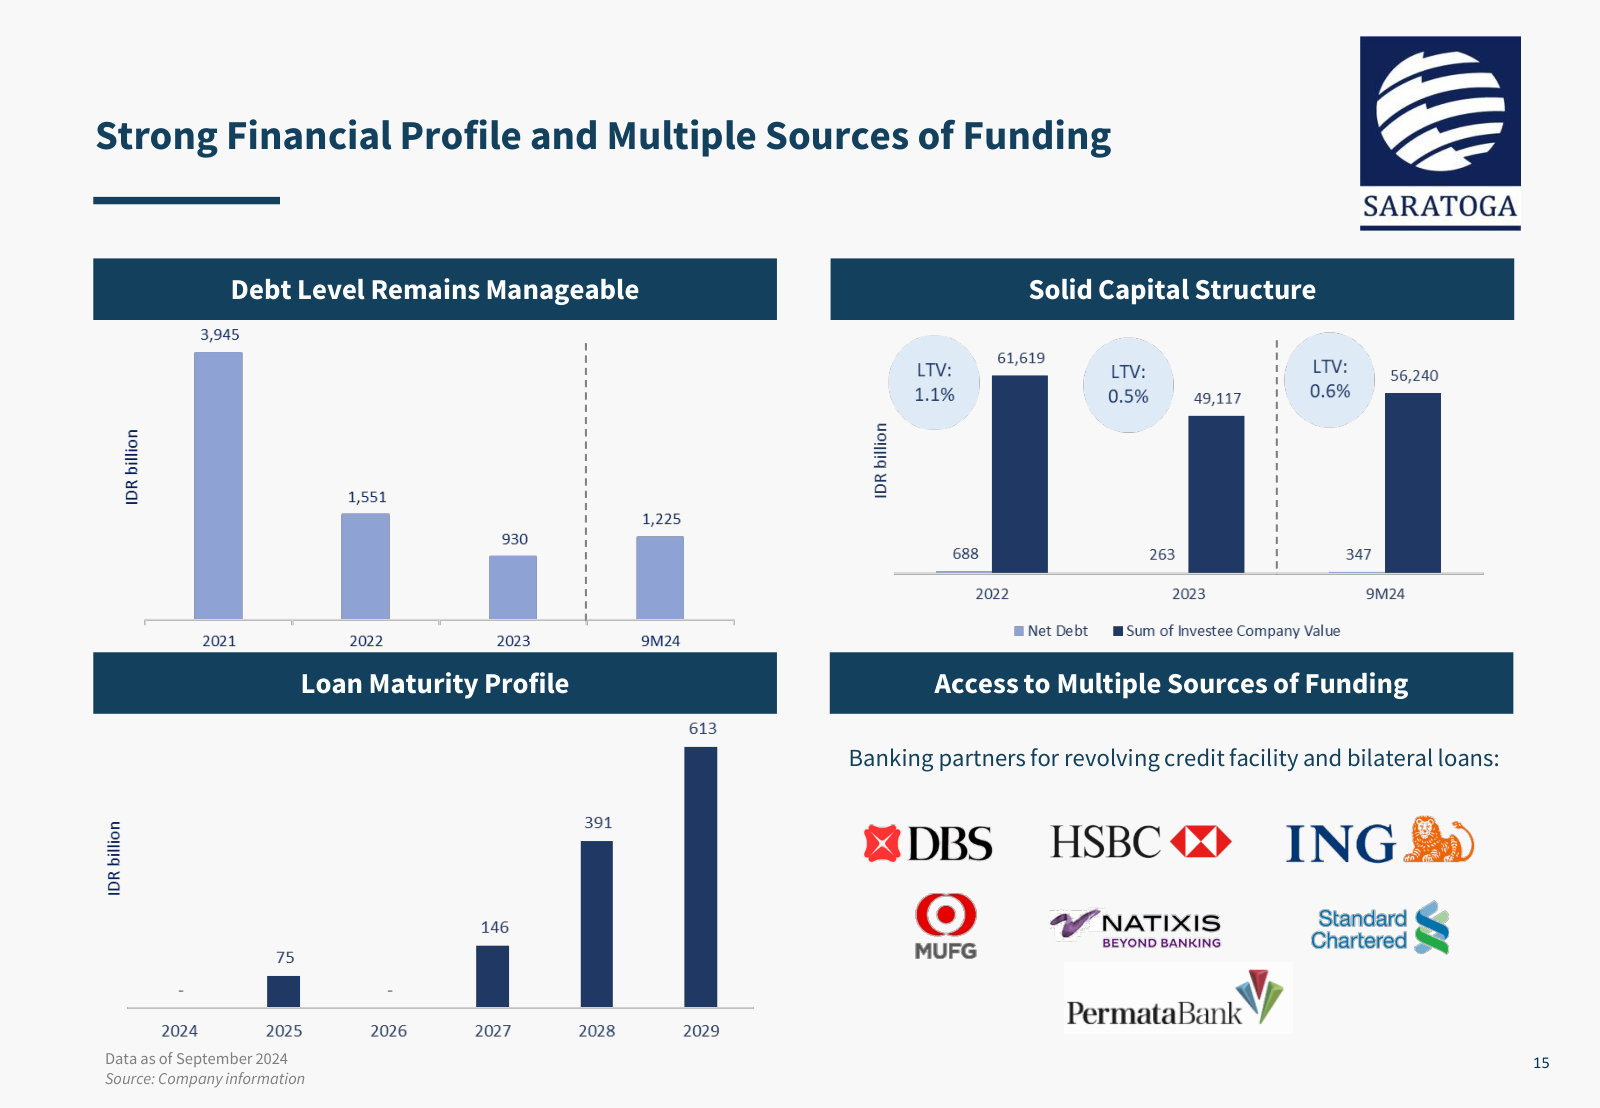
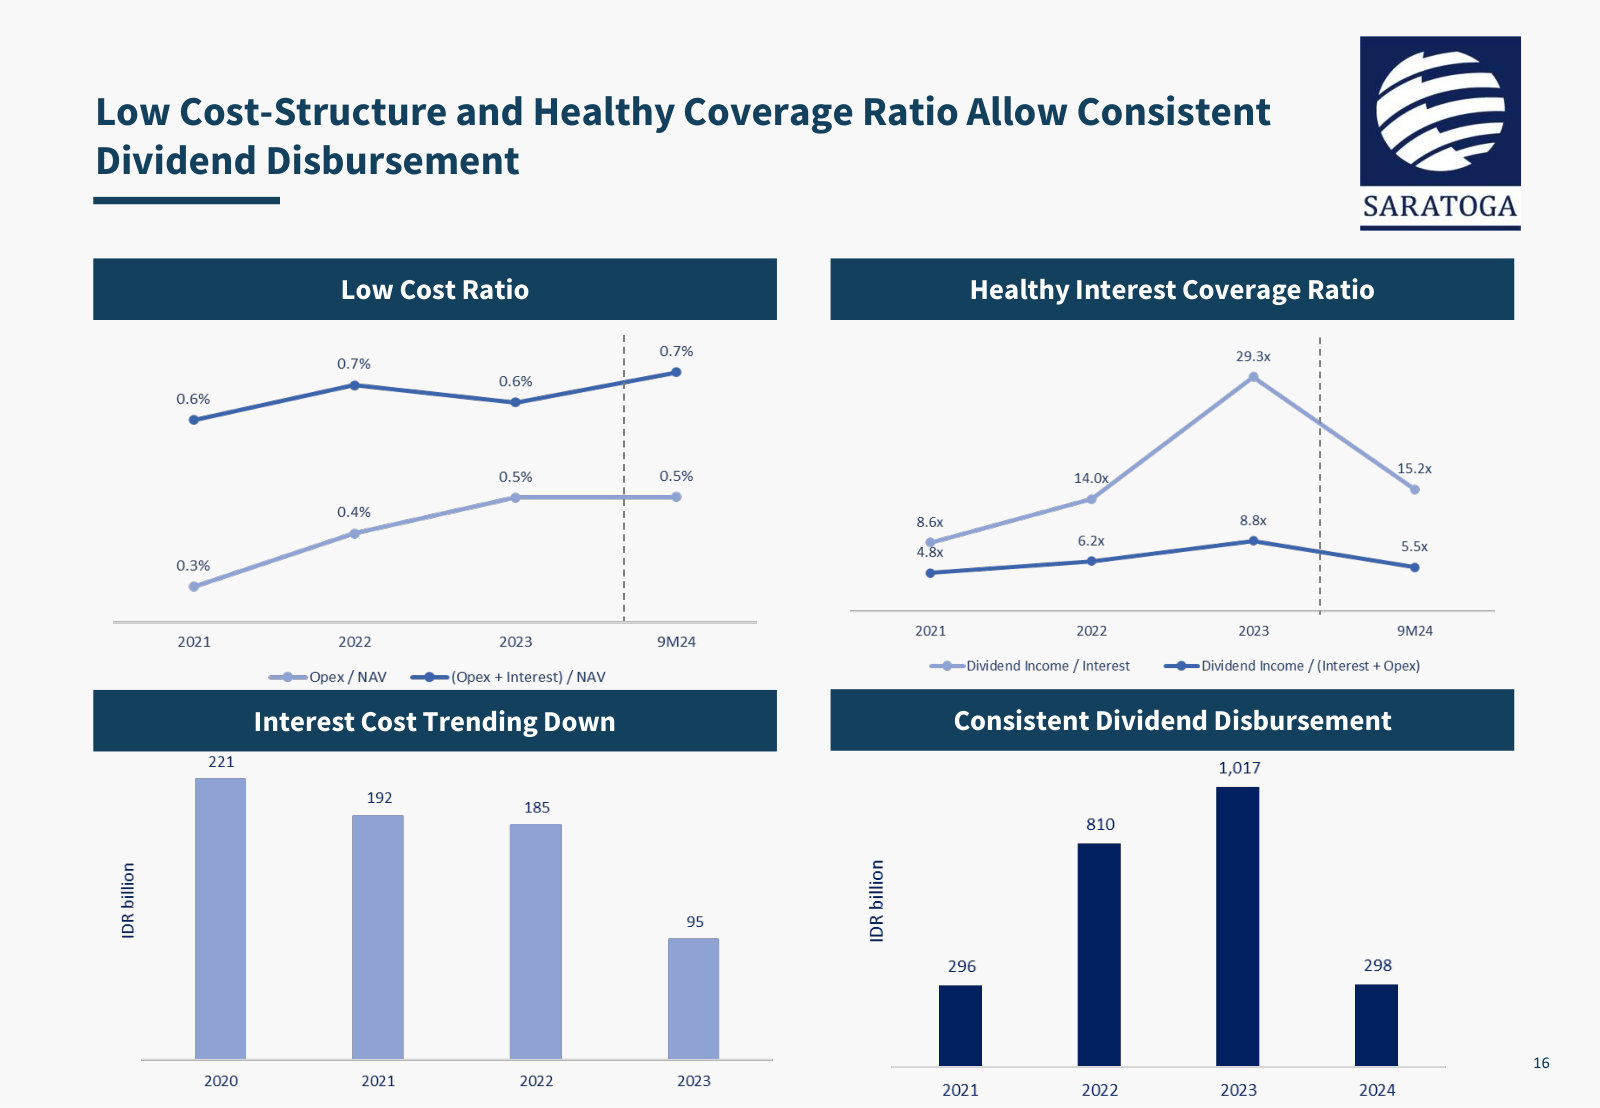
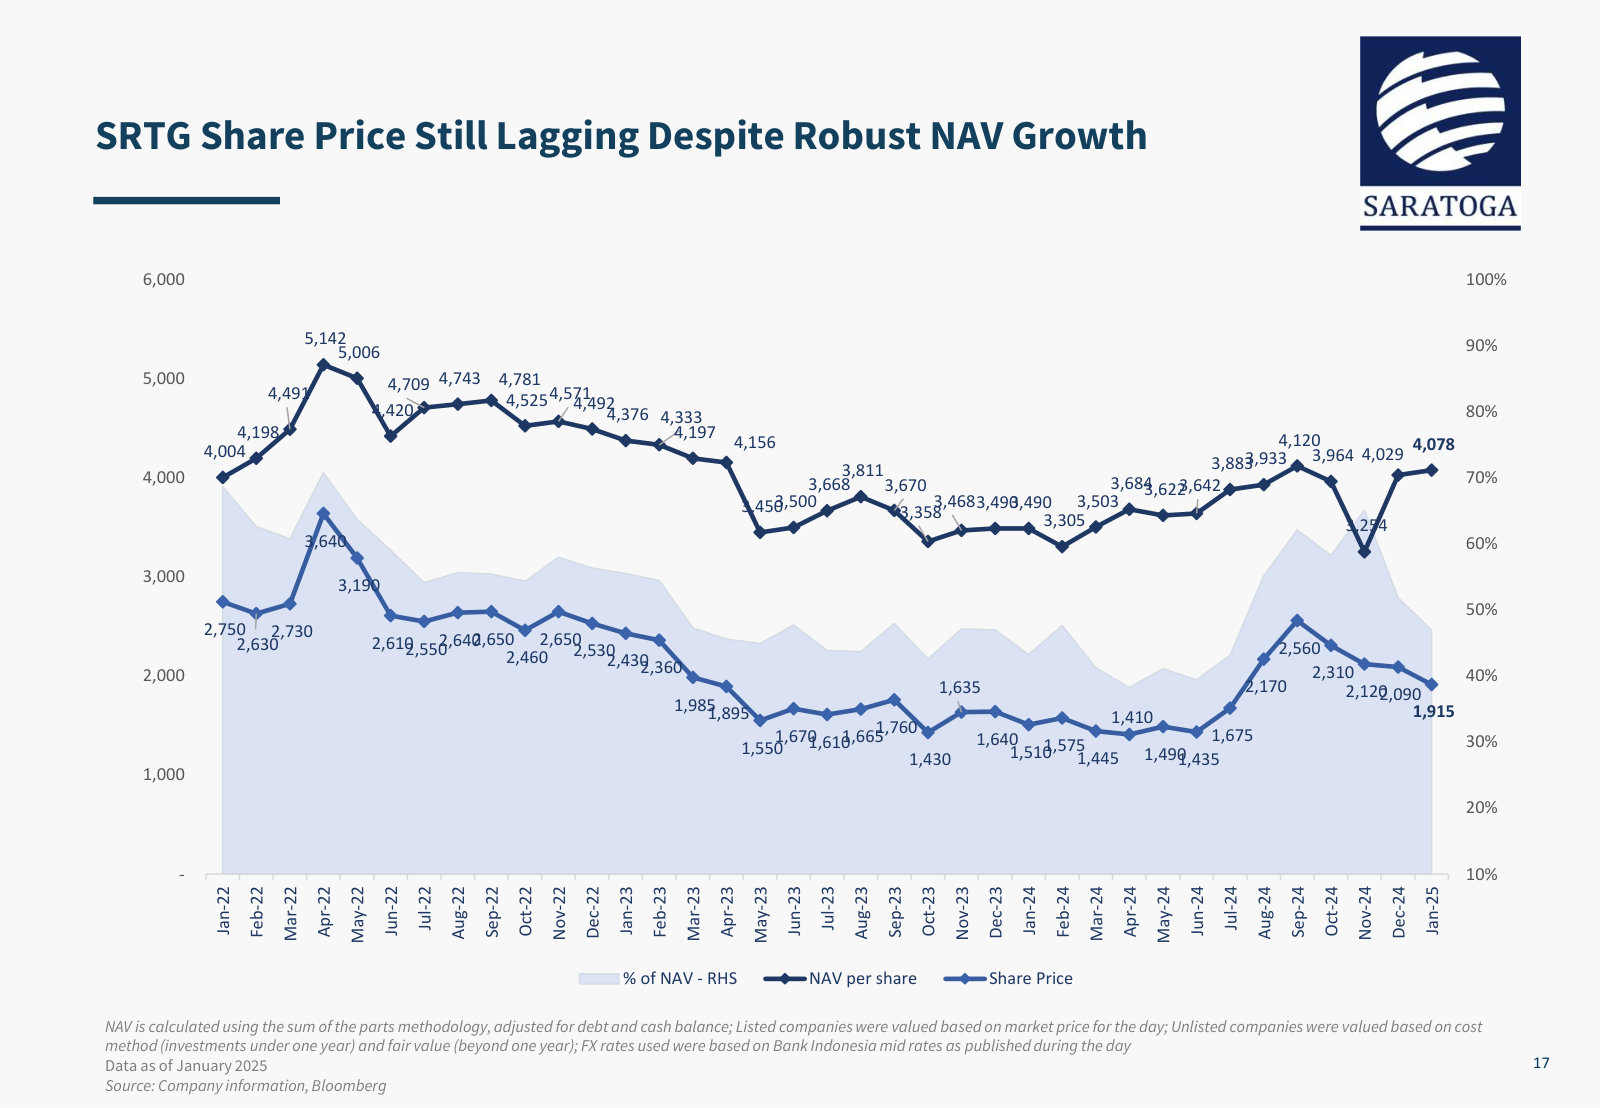
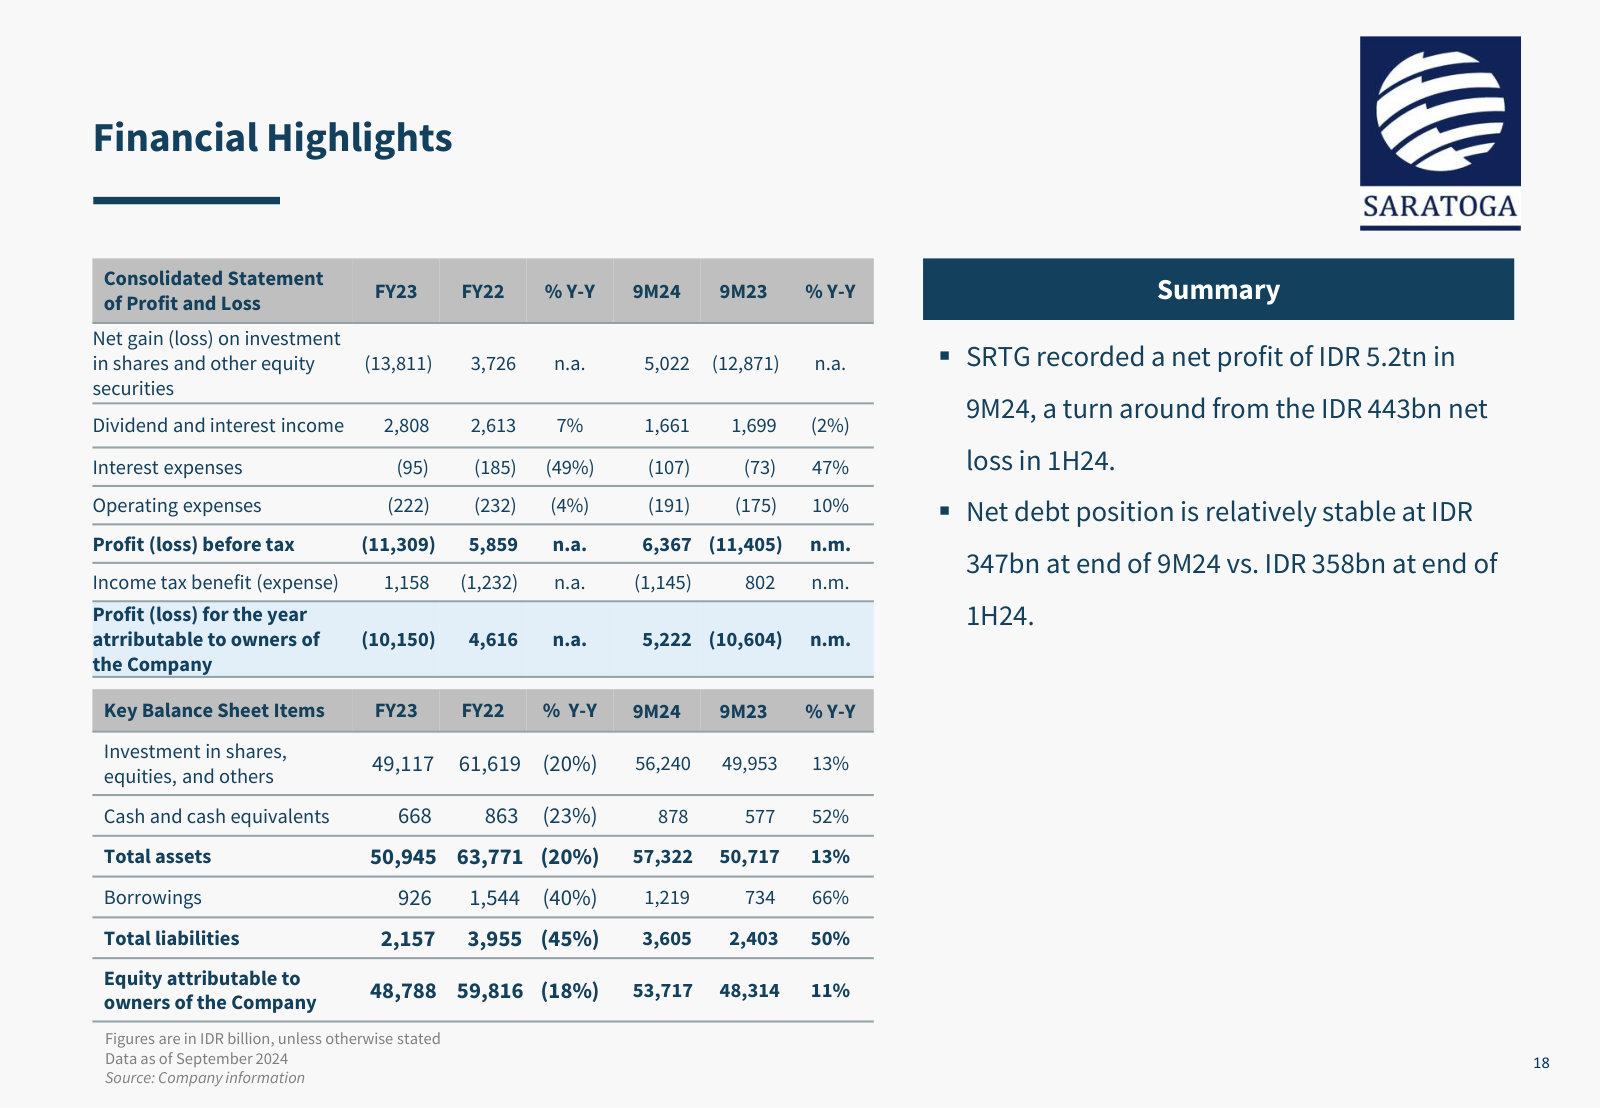
p. 4 — What Saratoga is in one page: an active investment company listed in 2013, with the ownership split between its three founding shareholders. · Open the full presentation →p. 5 — The investment mandate stated as numbers — USD 100–150mn deployed a year, target IRR above 20%, medium-to-long horizon. · Open the full presentation →p. 6 — Listed and unlisted portfolio value since 2018, plus the 2013-vs-2024 mix — the shift away from a TBIG/ADRO-dominated book. · Open the full presentation →p. 7 — Four holdings tracked from entry to maturity — the clearest evidence for the 'transform early-stage into established' claim. · Open the full presentation →p. 8 — The portfolio split into blue chip and growth, each name tagged with what it actually does. · Open the full presentation →p. 10 — Brawijaya Healthcare, the 2024 control acquisition: premium hospitals, 50–150 beds each, 1–2 added per year. · Open the full presentation →p. 11 — ZAP's clinic footprint and treatment mix — the consumer-health holding's unit of expansion. · Open the full presentation →p. 12 — The digital holdings: BDDC's Jakarta data-centre capacity and City Vision's transit-media network. · Open the full presentation →p. 13 — The energy-transition theses in one place — ADRO hydro, MBMA's HPAL nickel, Forest Carbon and Xurya. · Open the full presentation →p. 14 — Investment versus divestment by year alongside dividend income by investee — how cash actually reaches the holding company. · Open the full presentation →p. 15 — Debt, loan-to-value, maturity schedule and lending banks — the leverage a NAV-based holding company runs. · Open the full presentation →p. 16 — Opex and interest as a share of NAV, coverage ratios and dividends paid — the cost of running the vehicle. · Open the full presentation →p. 17 — NAV per share against the share price since 2022; the discount is the central valuation question for this stock. · Open the full presentation →p. 18 — Consolidated P&L and balance sheet, showing how mark-to-market swings on investments drive reported profit. · Open the full presentation →
The deck stops at January 2025; these are the annual report's chart and diagram pages, carrying the current portfolio list, ownership map and the full sum-of-the-parts NAV. · Open the full document →
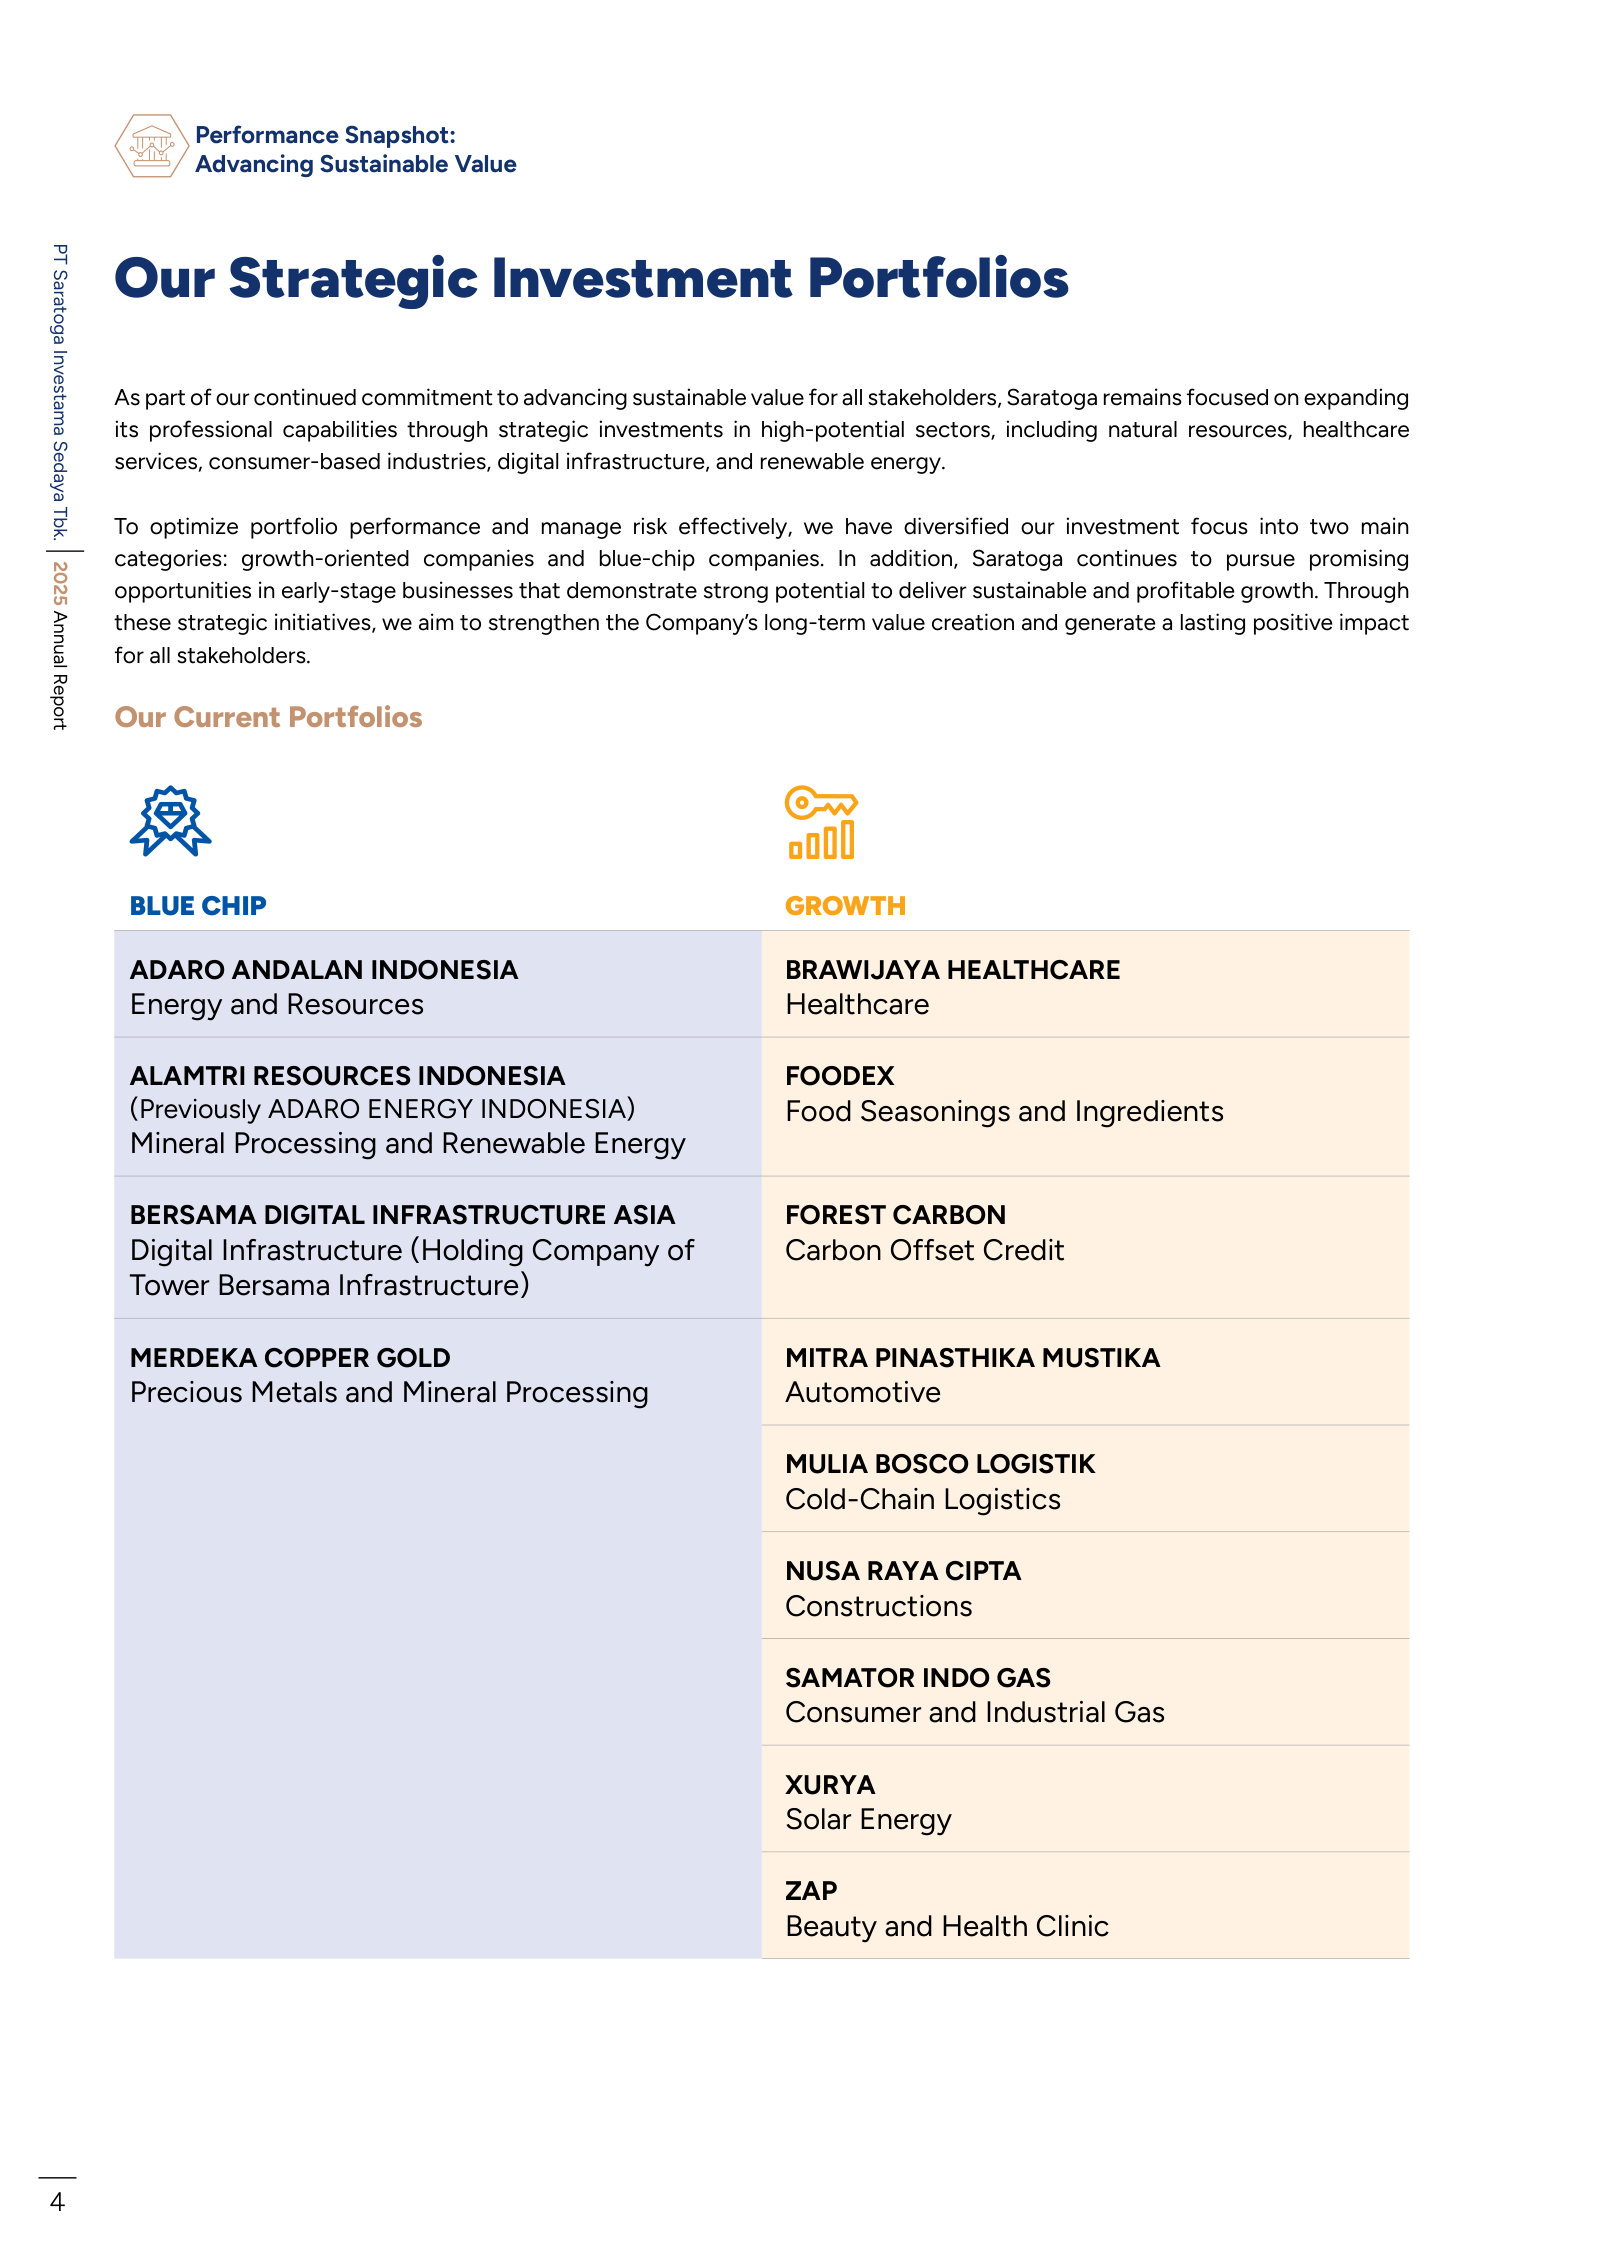
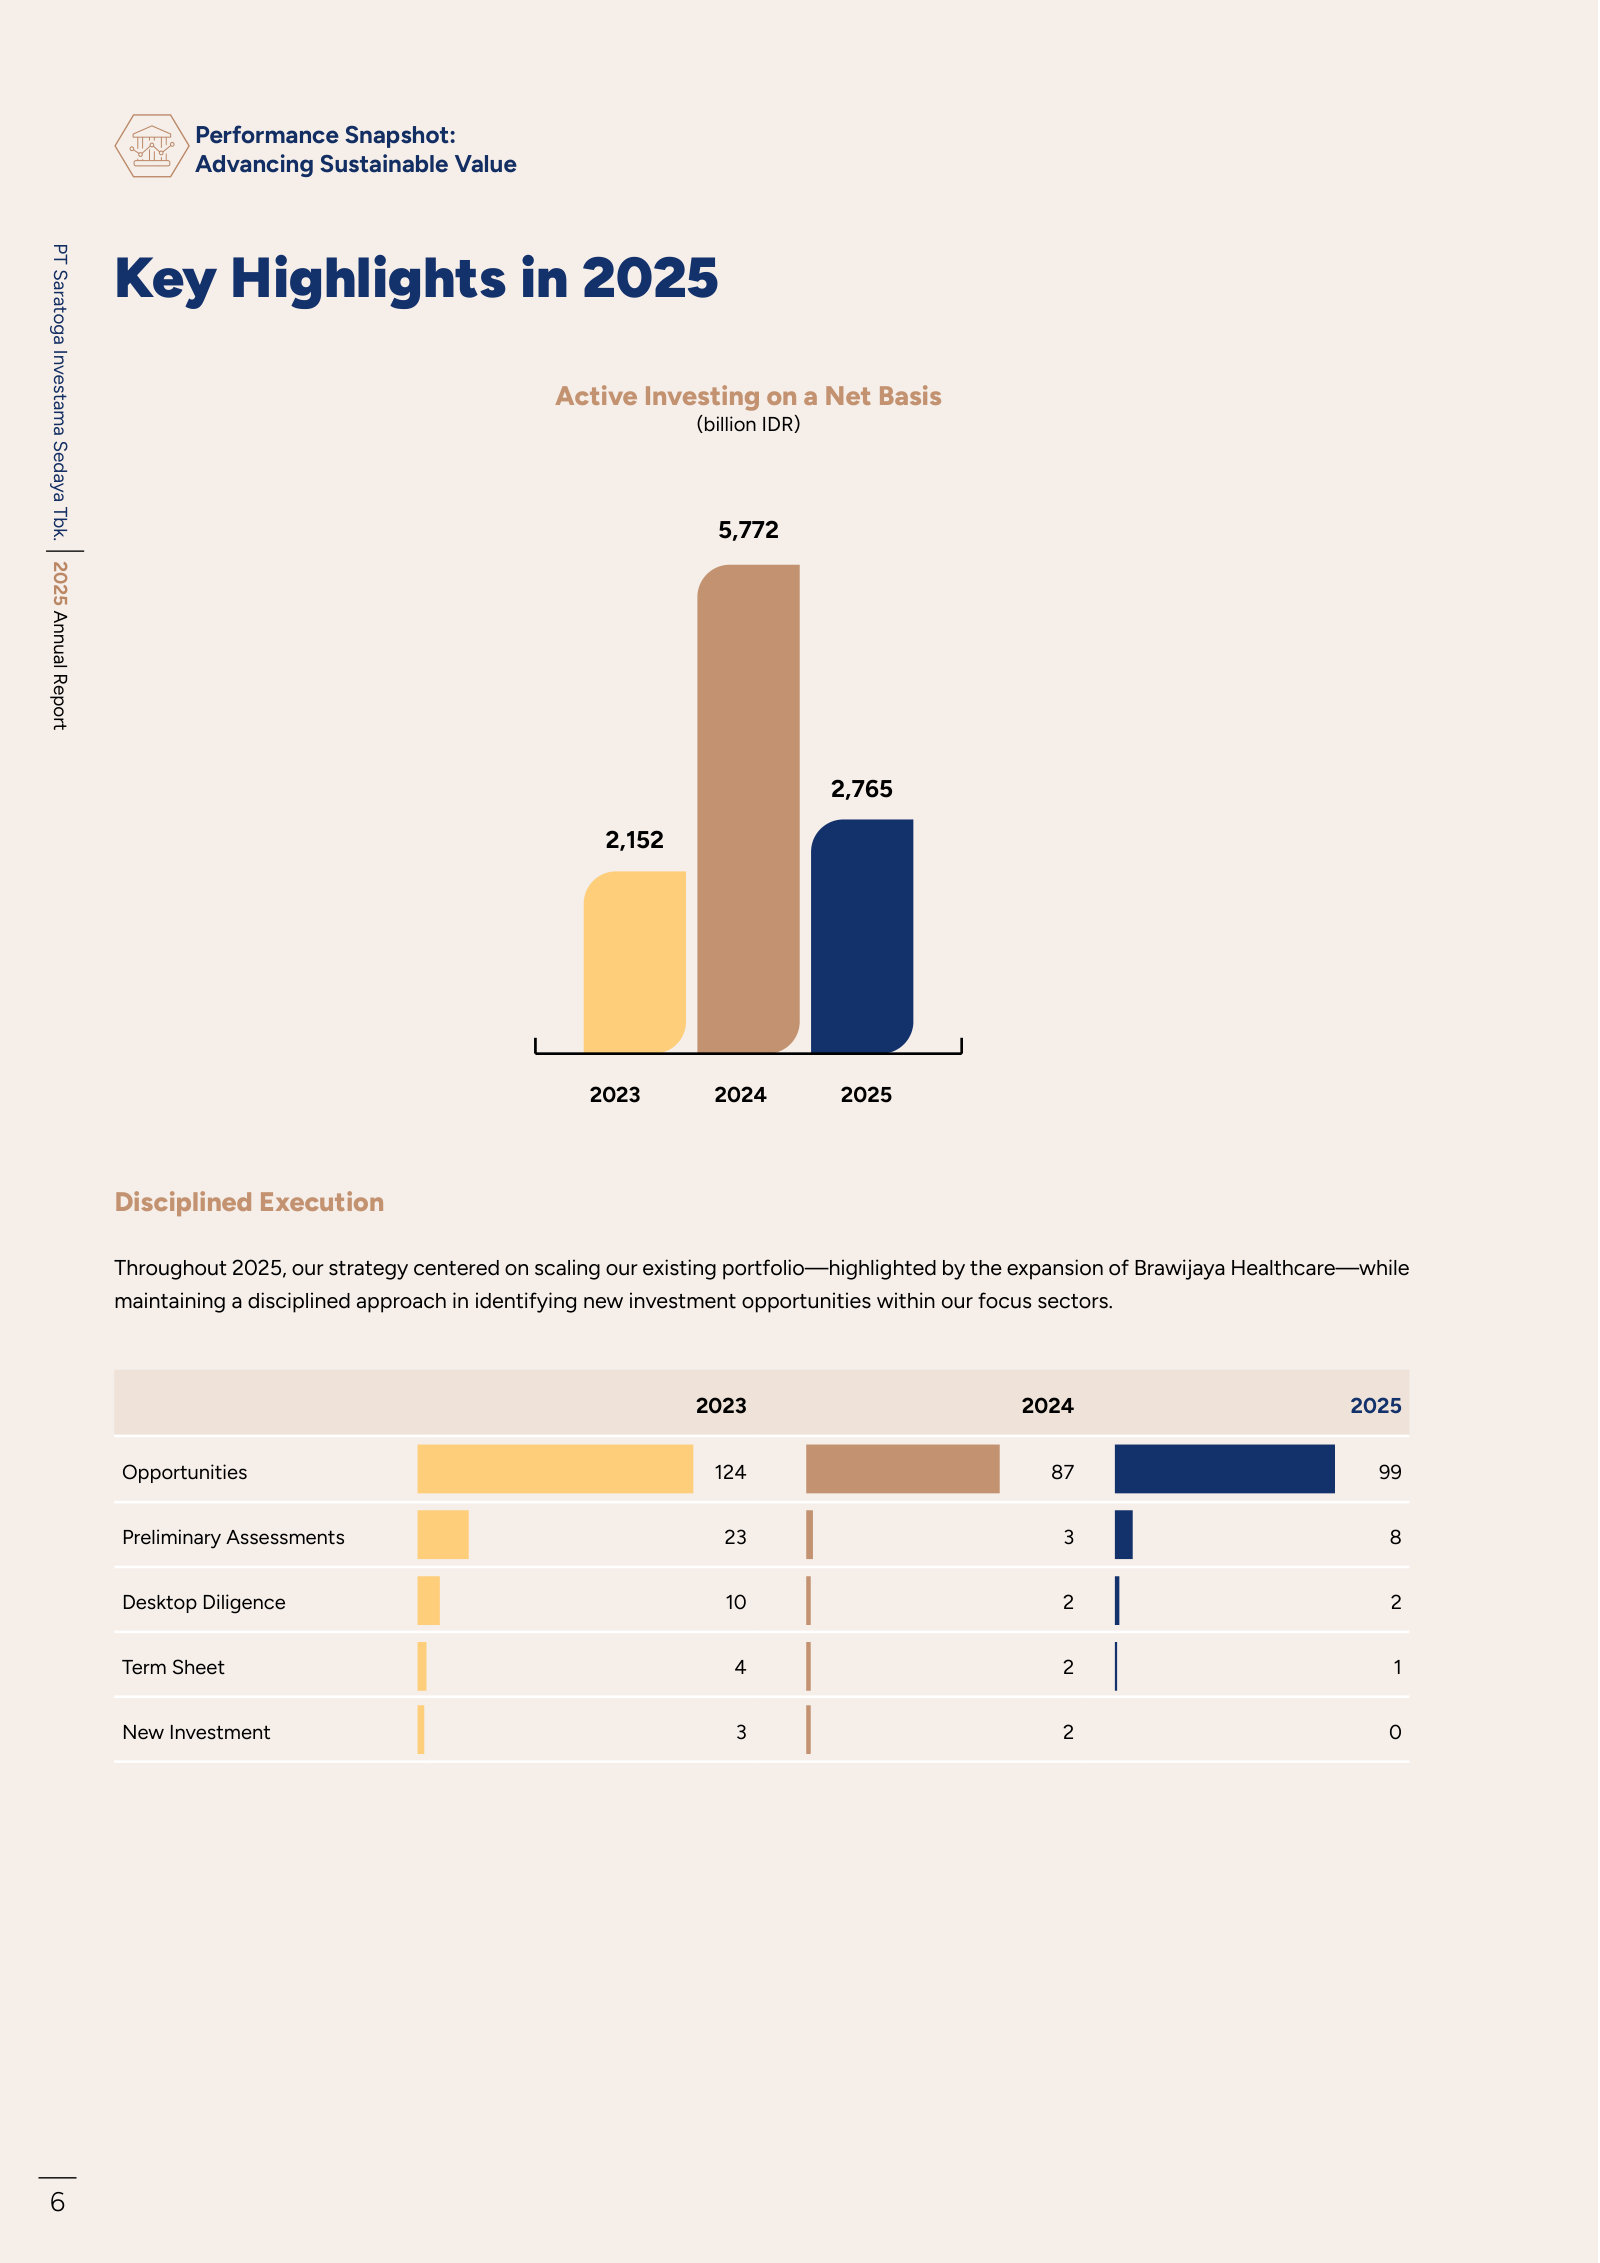
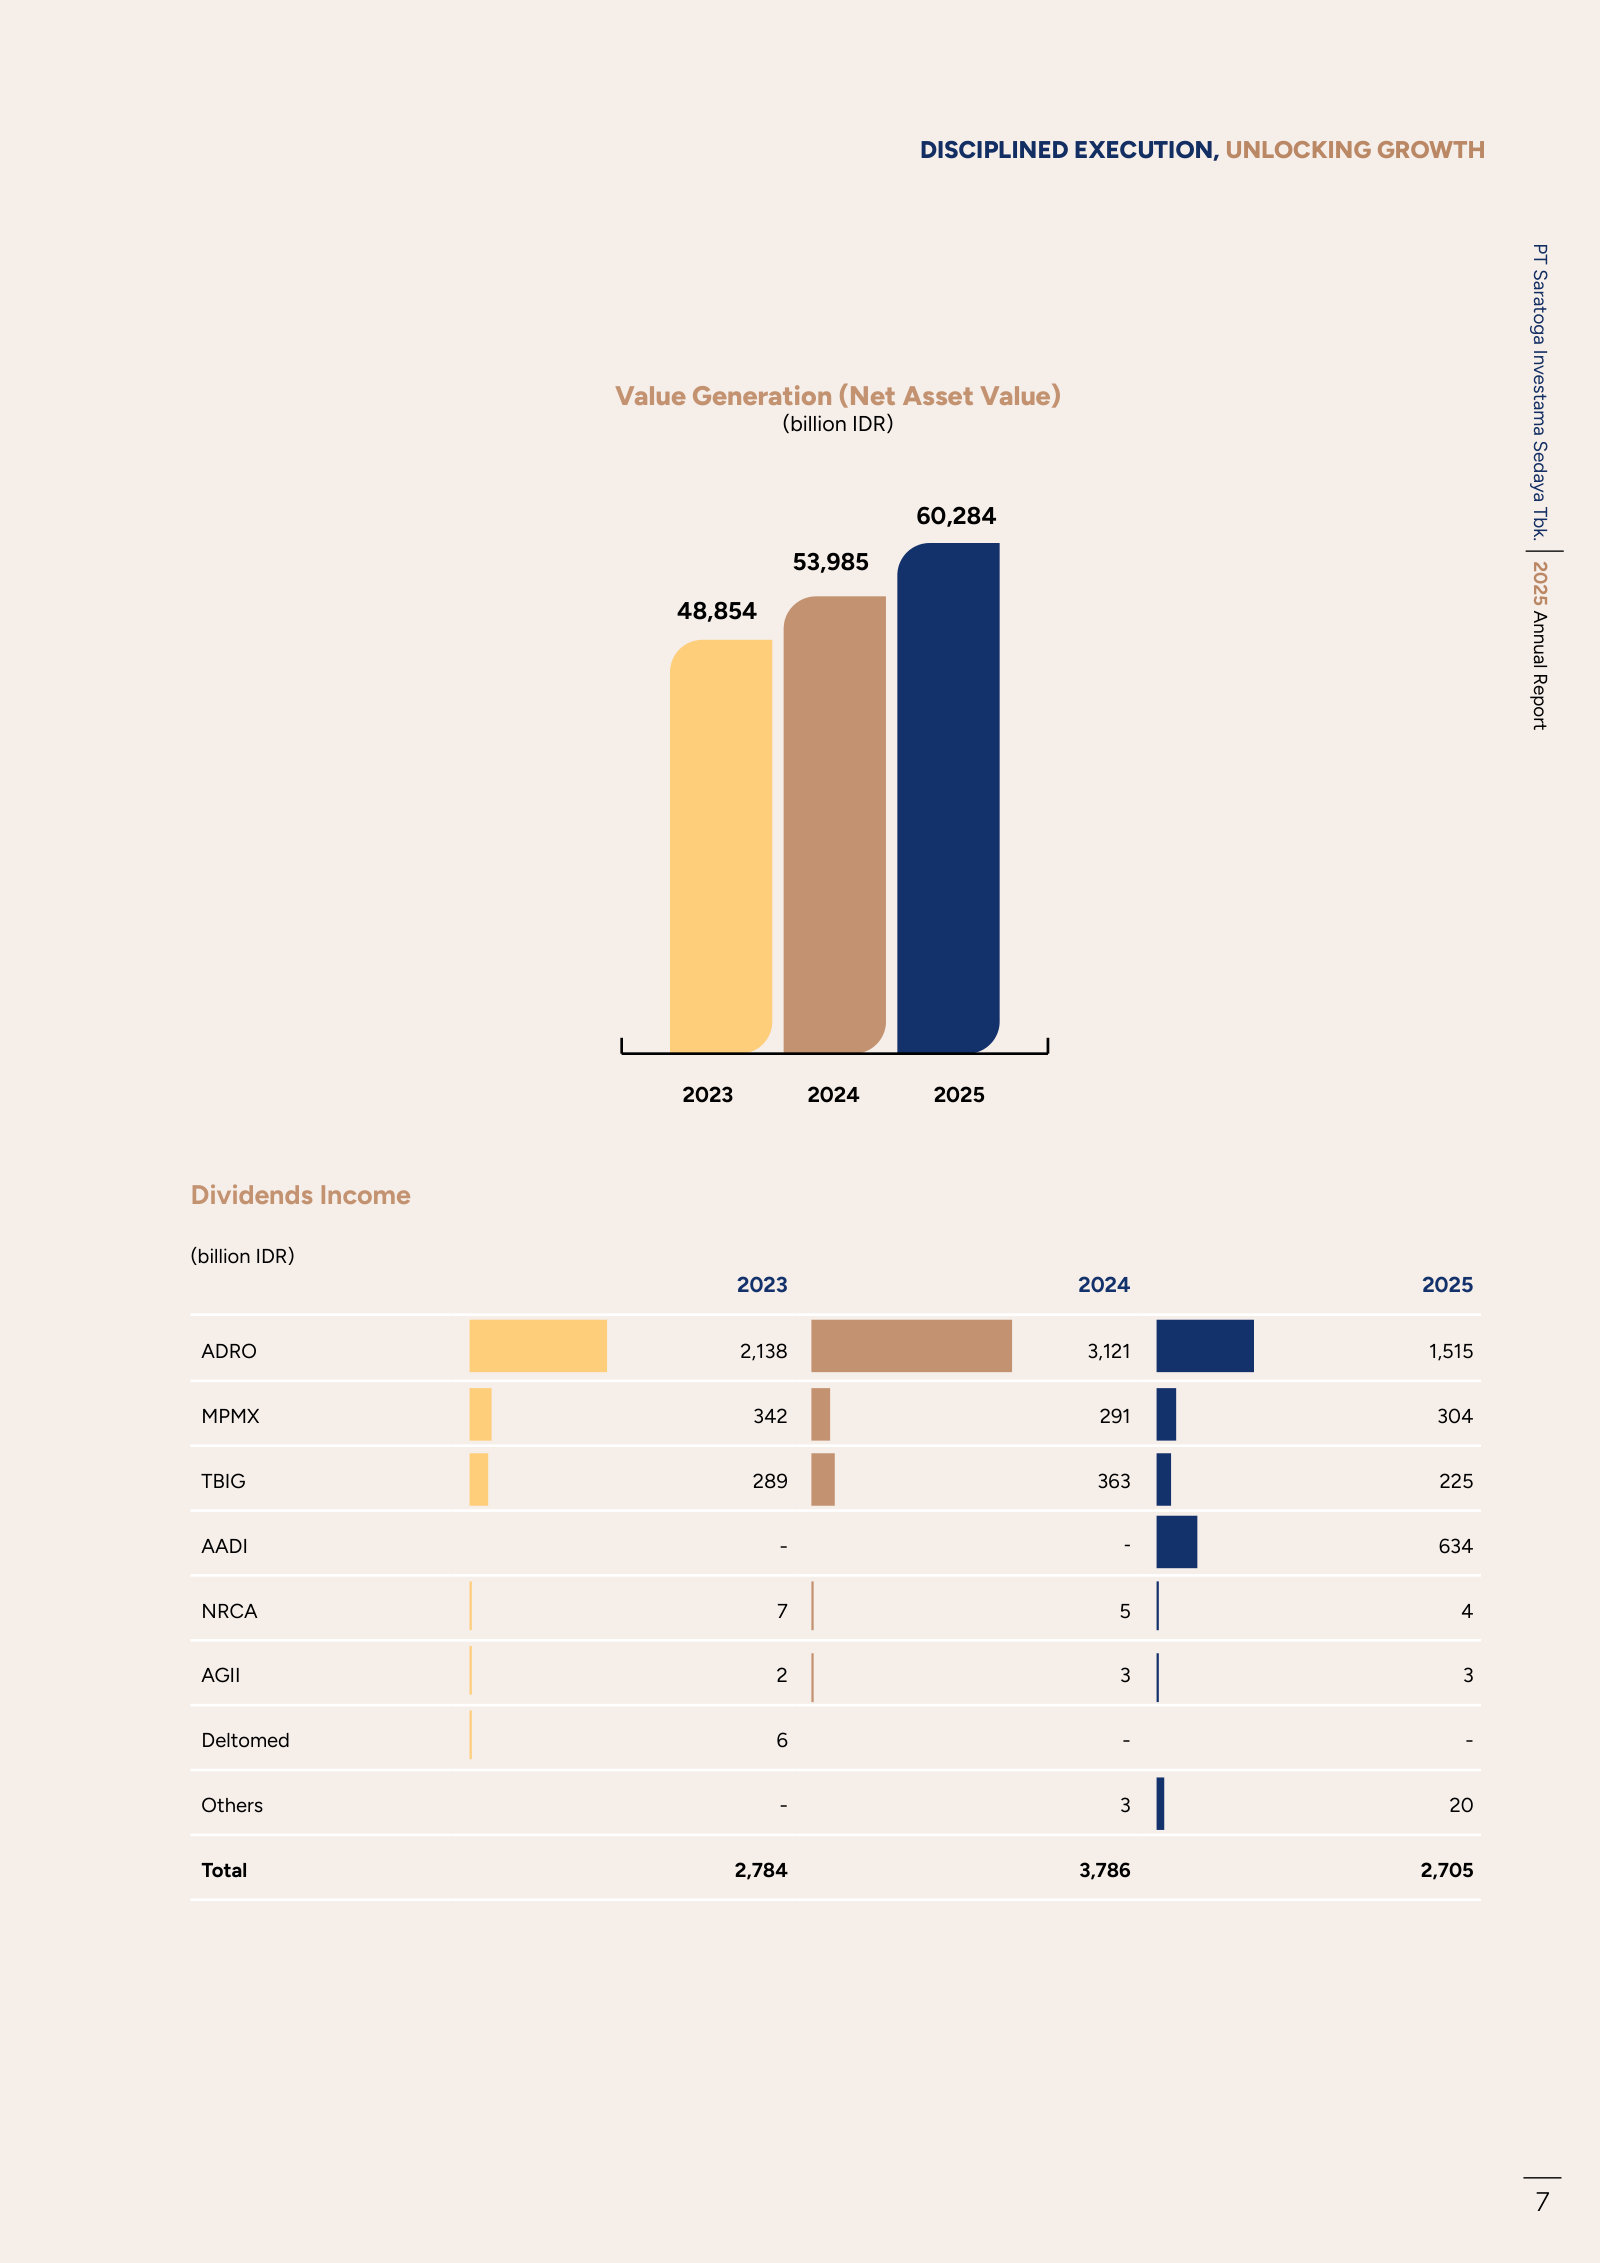
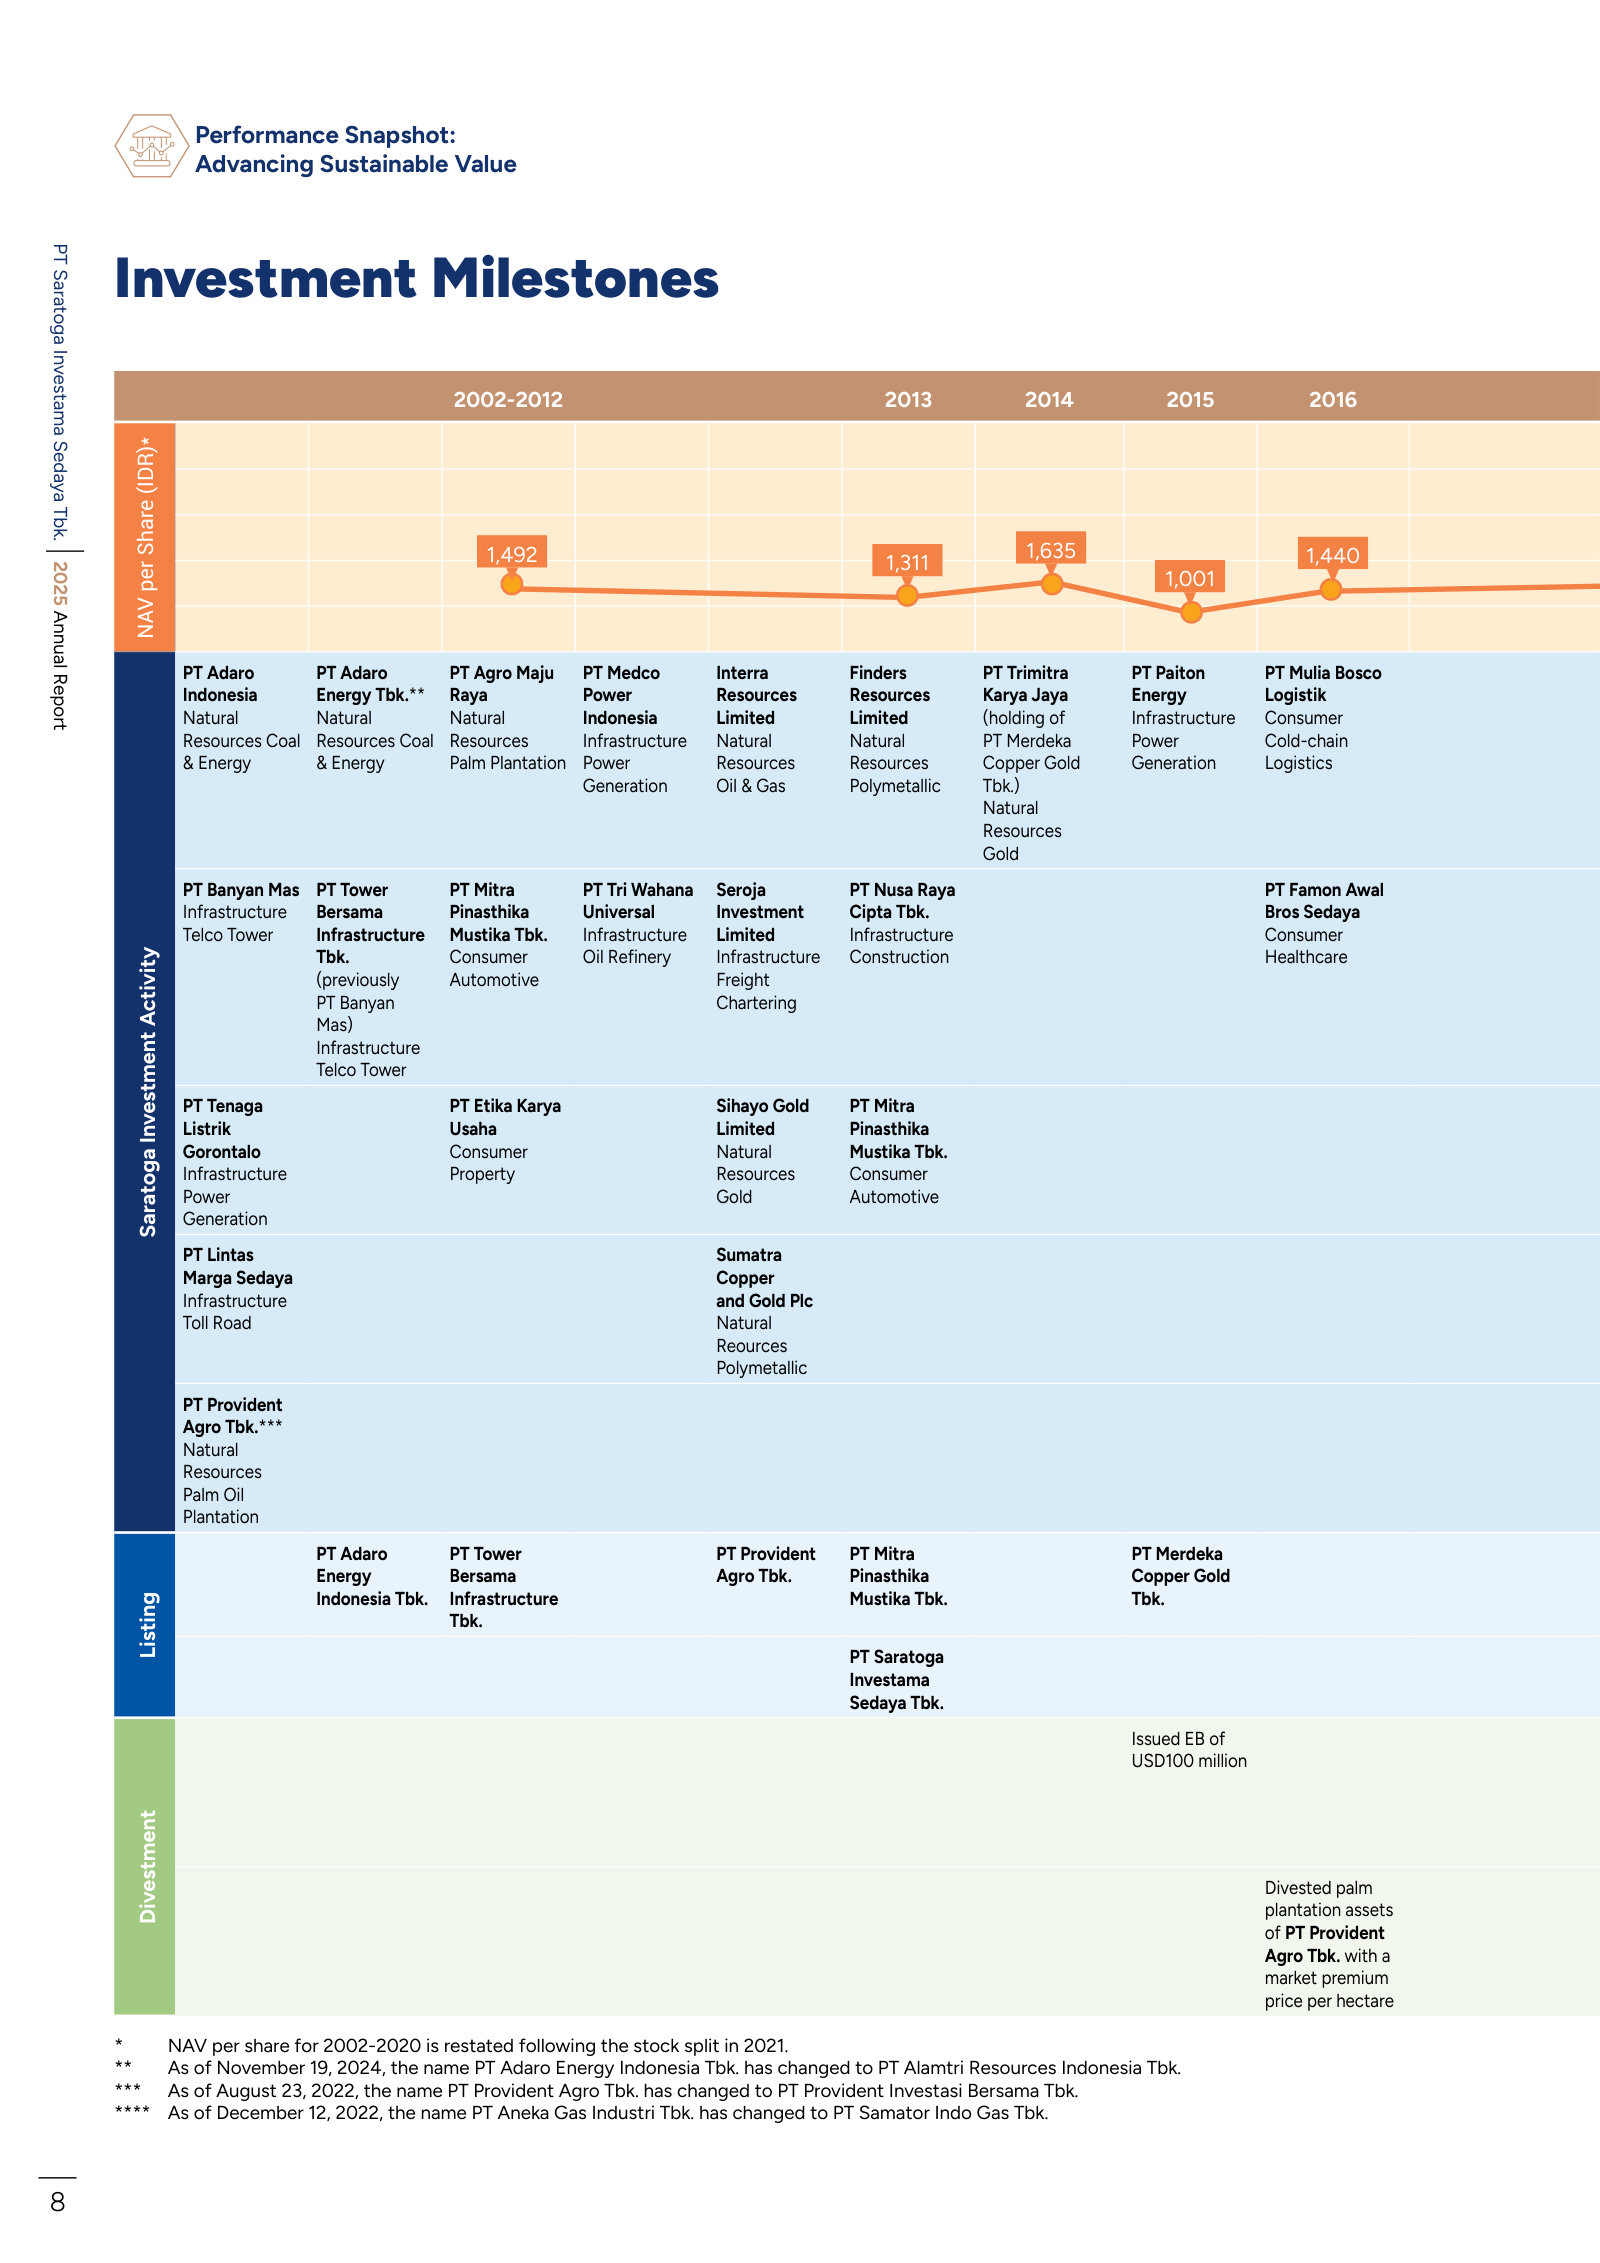
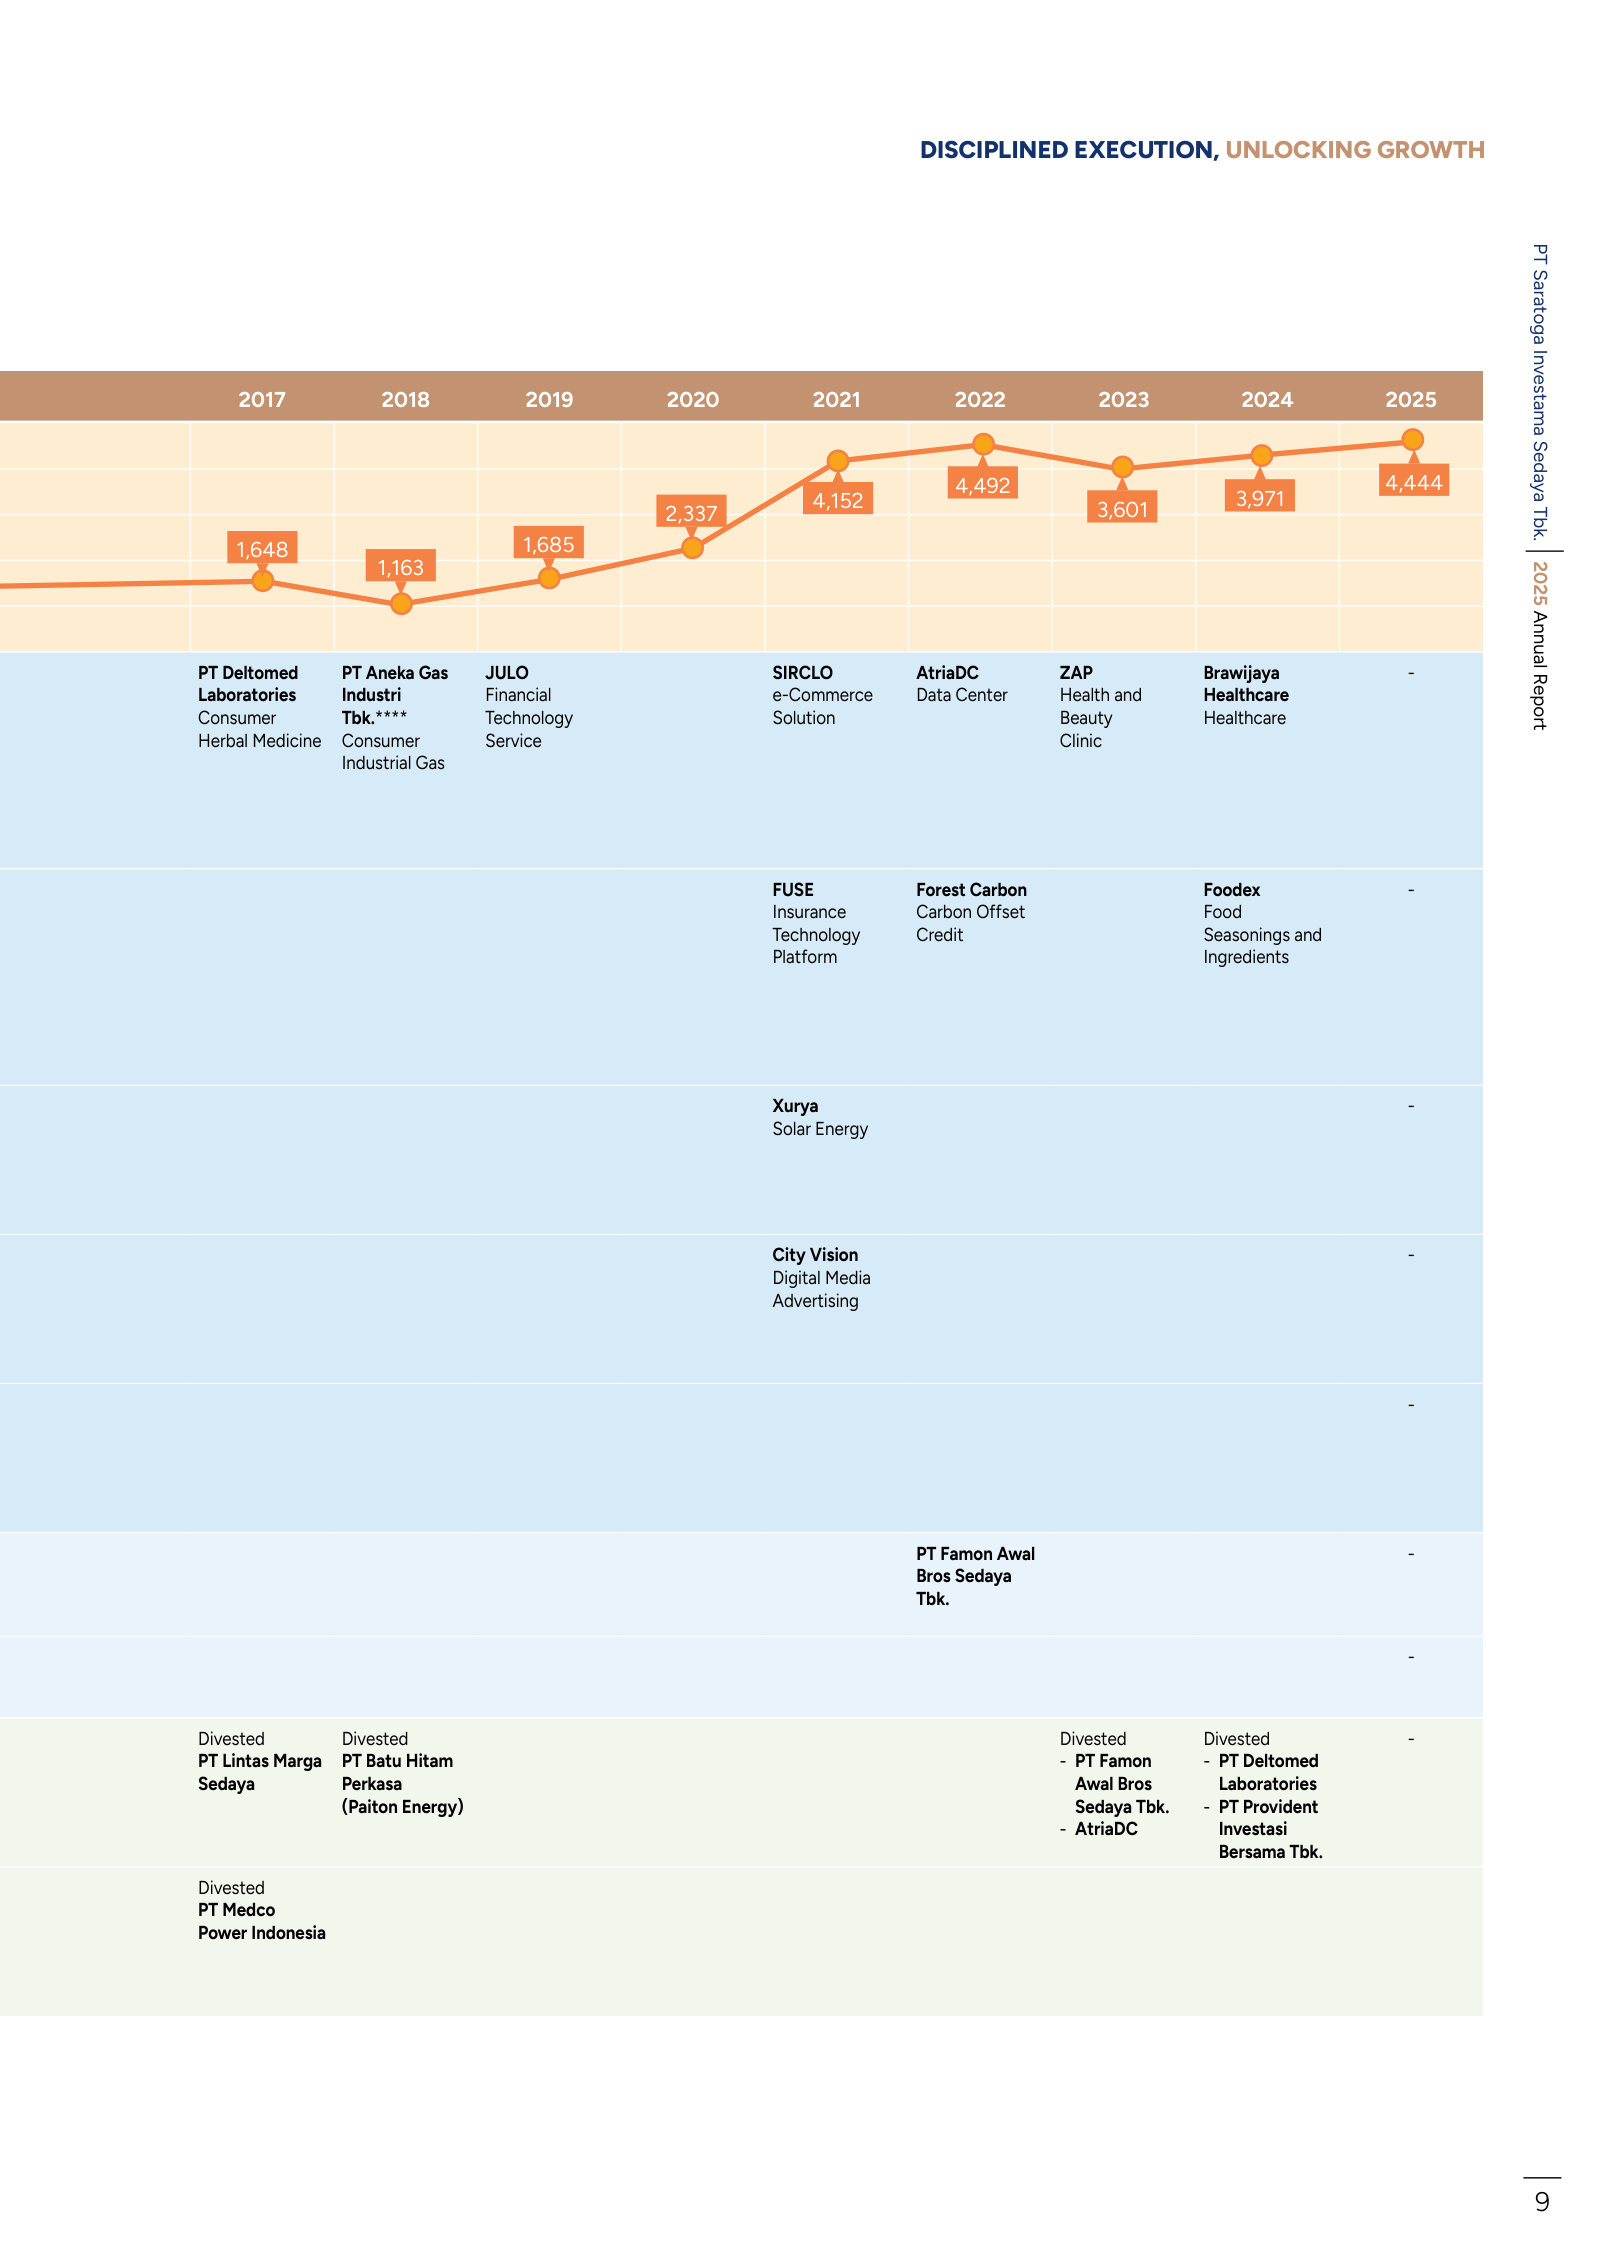
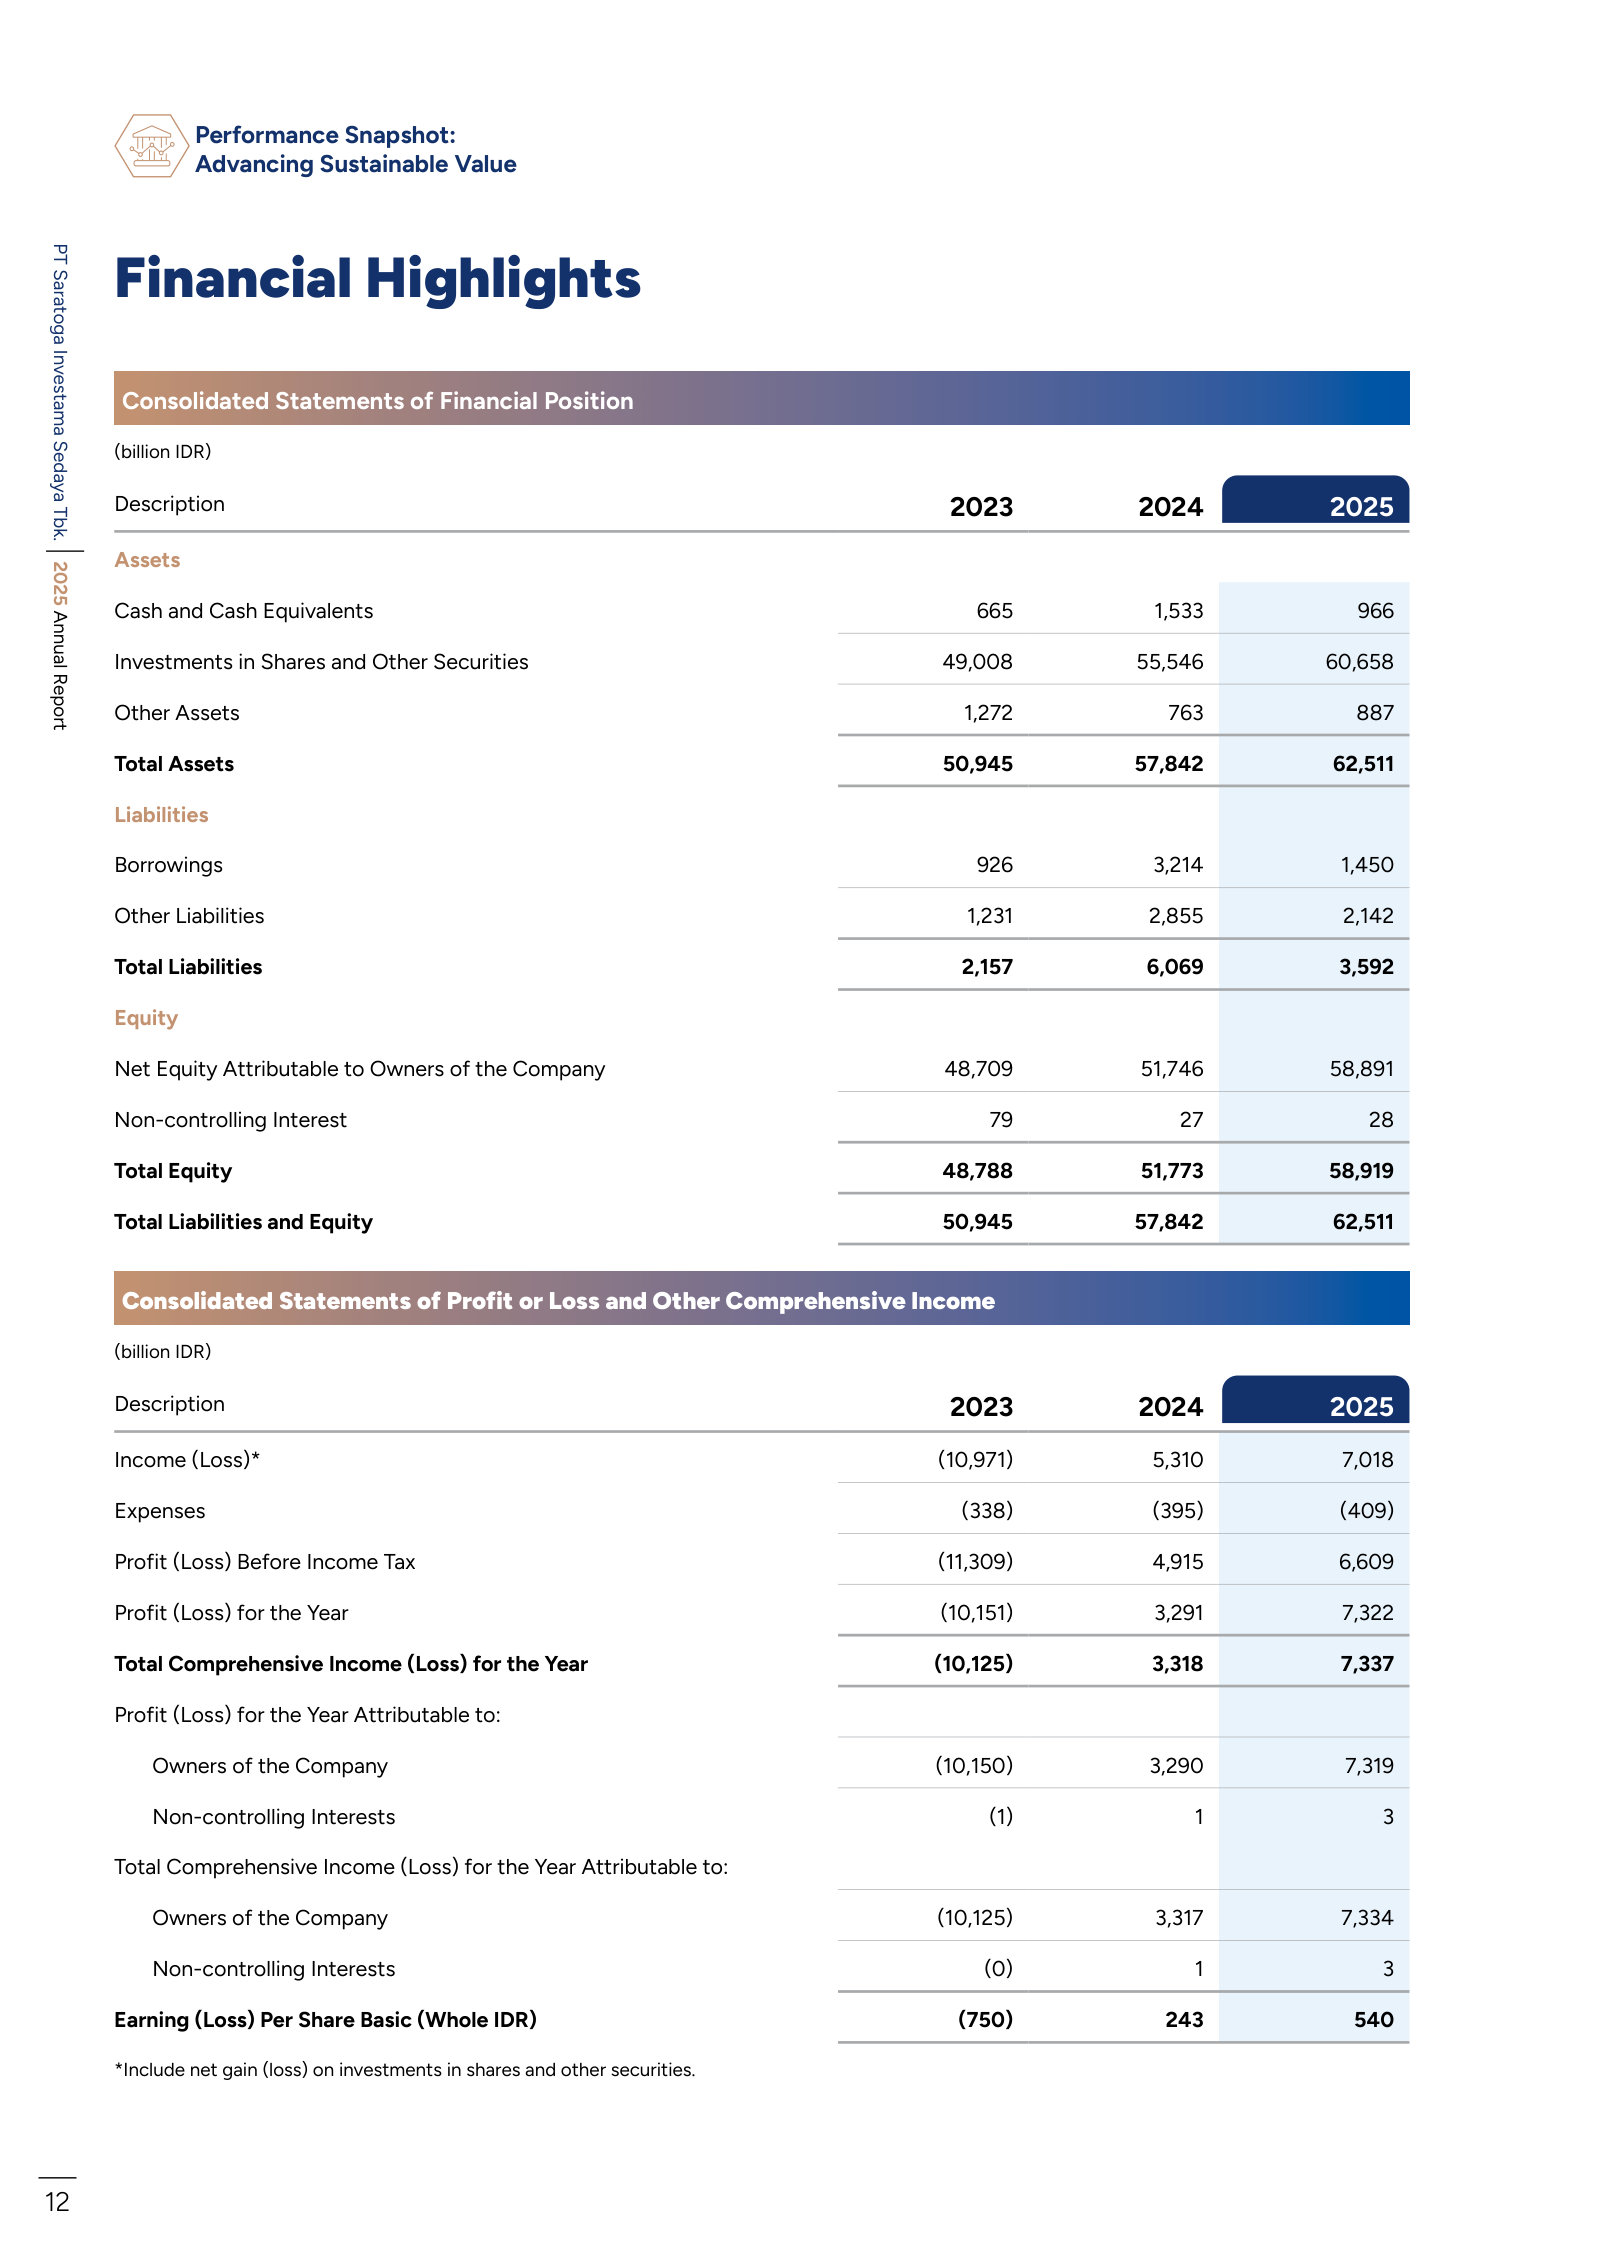
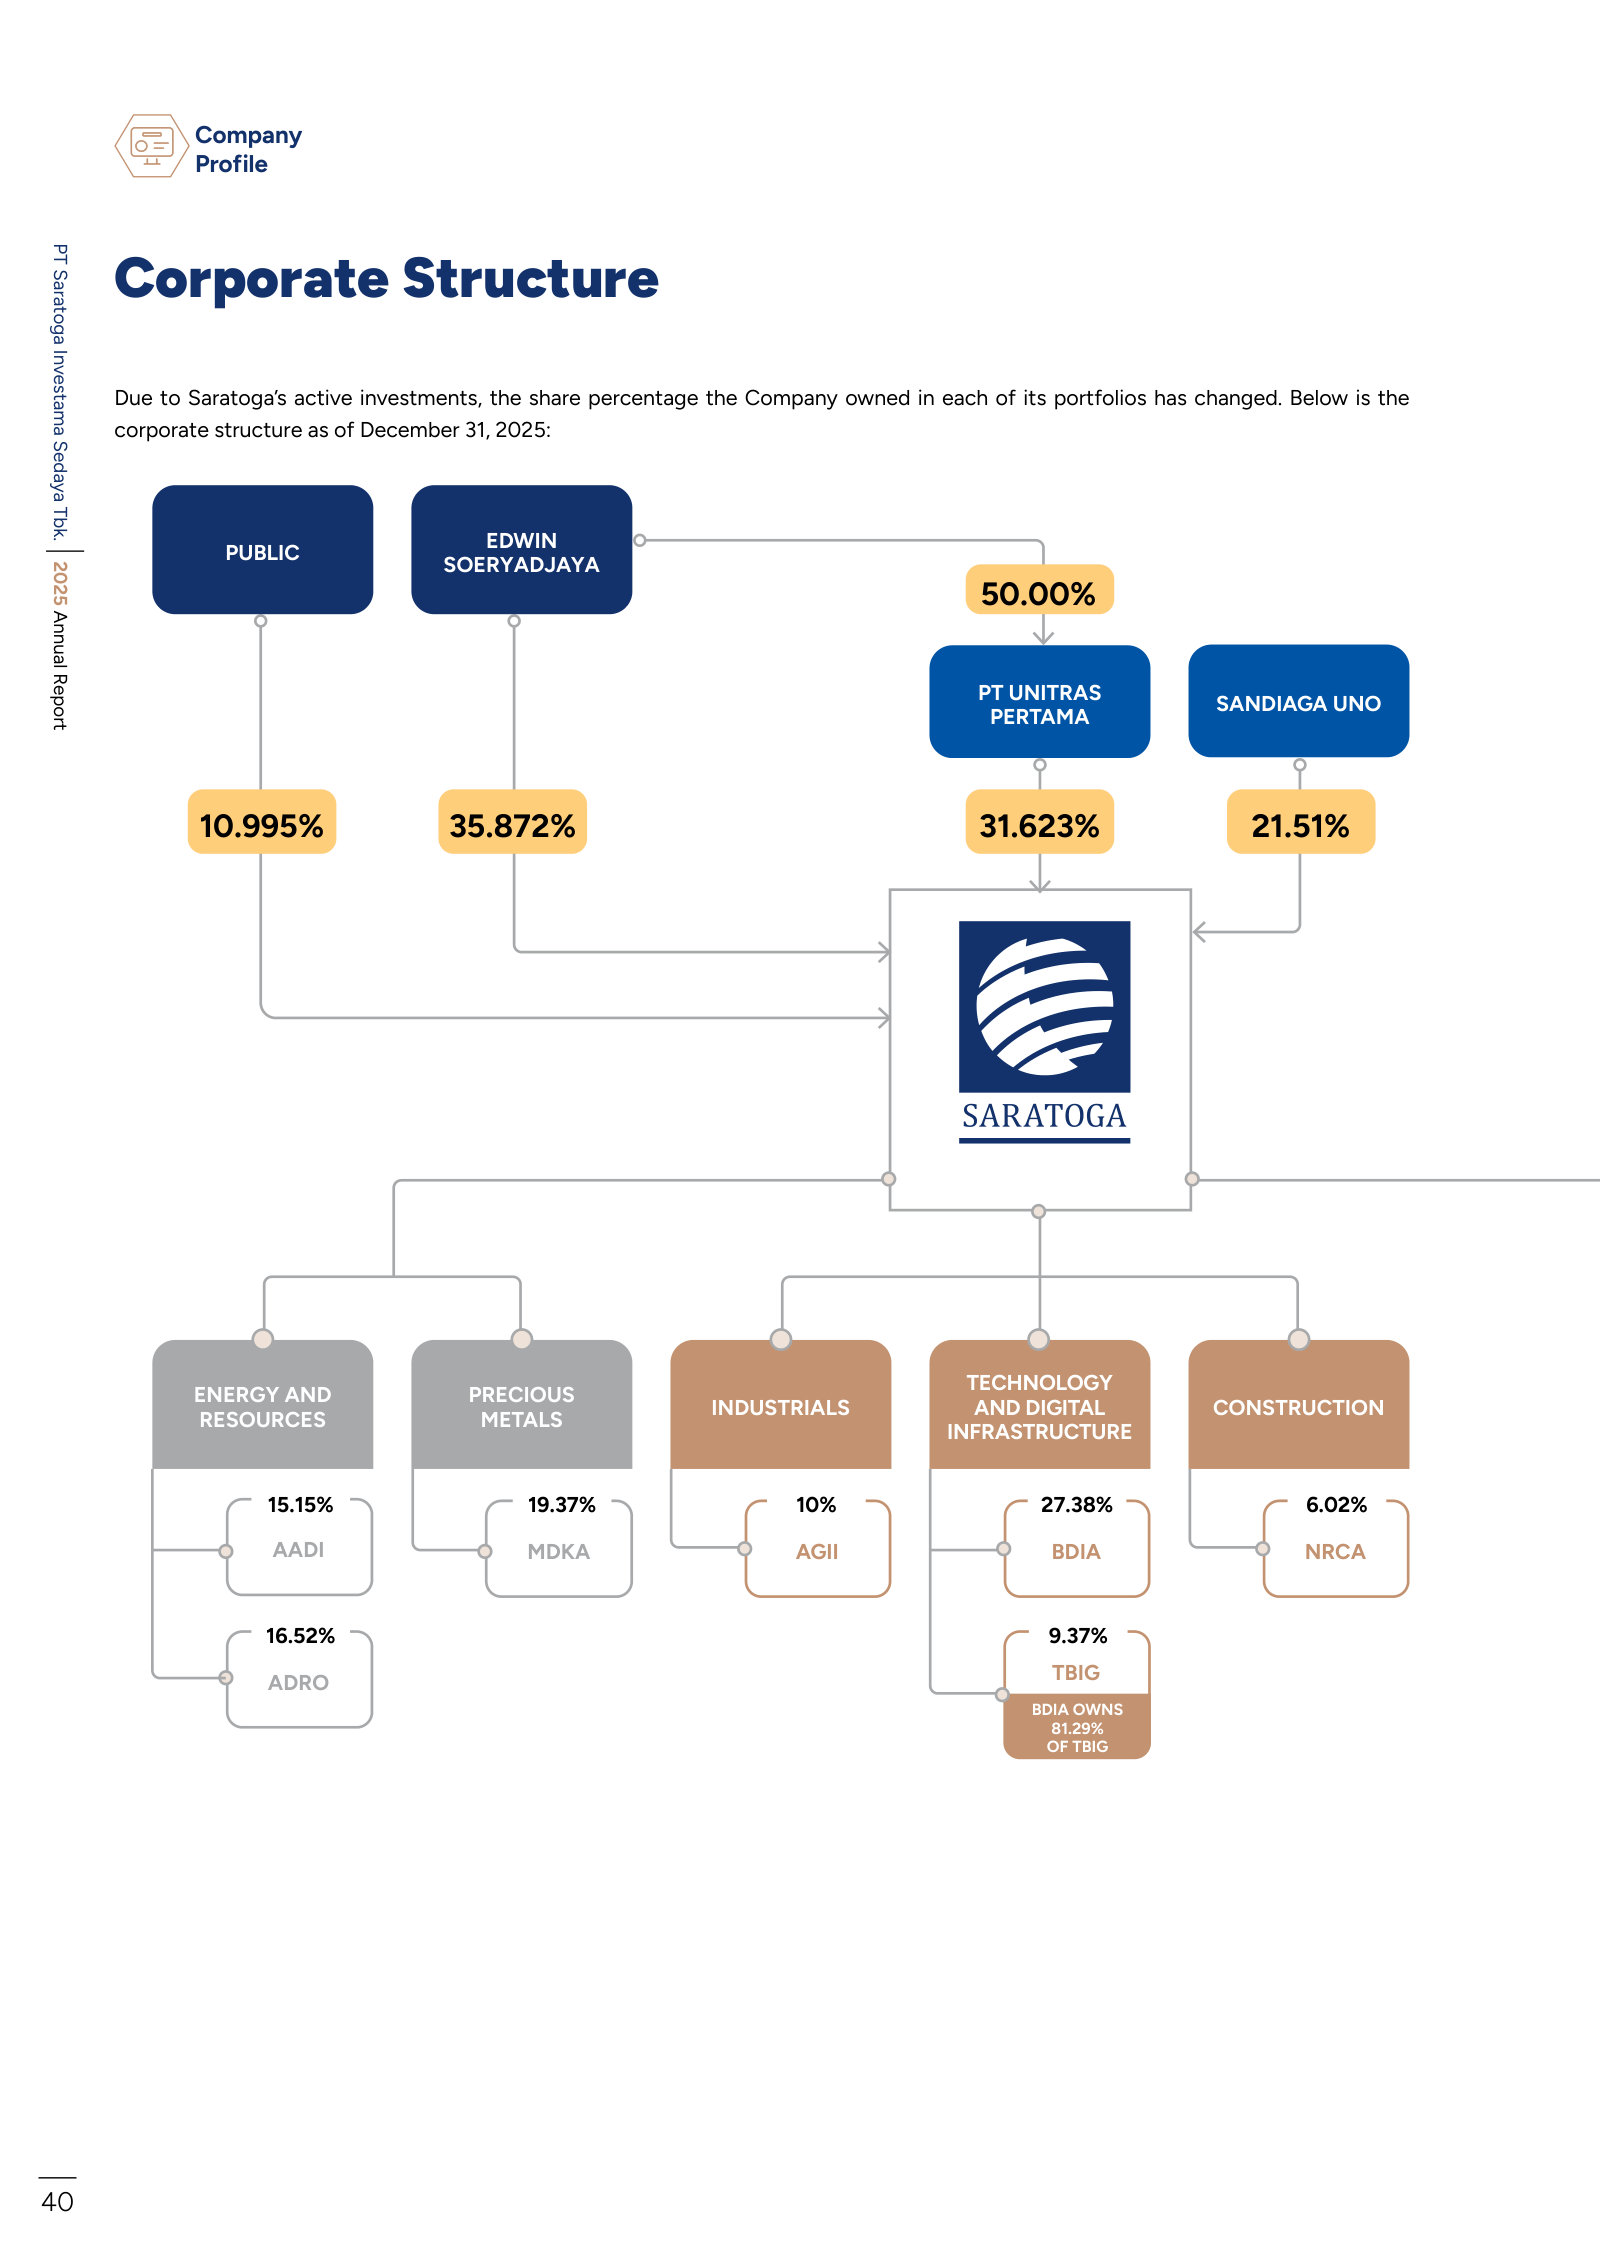
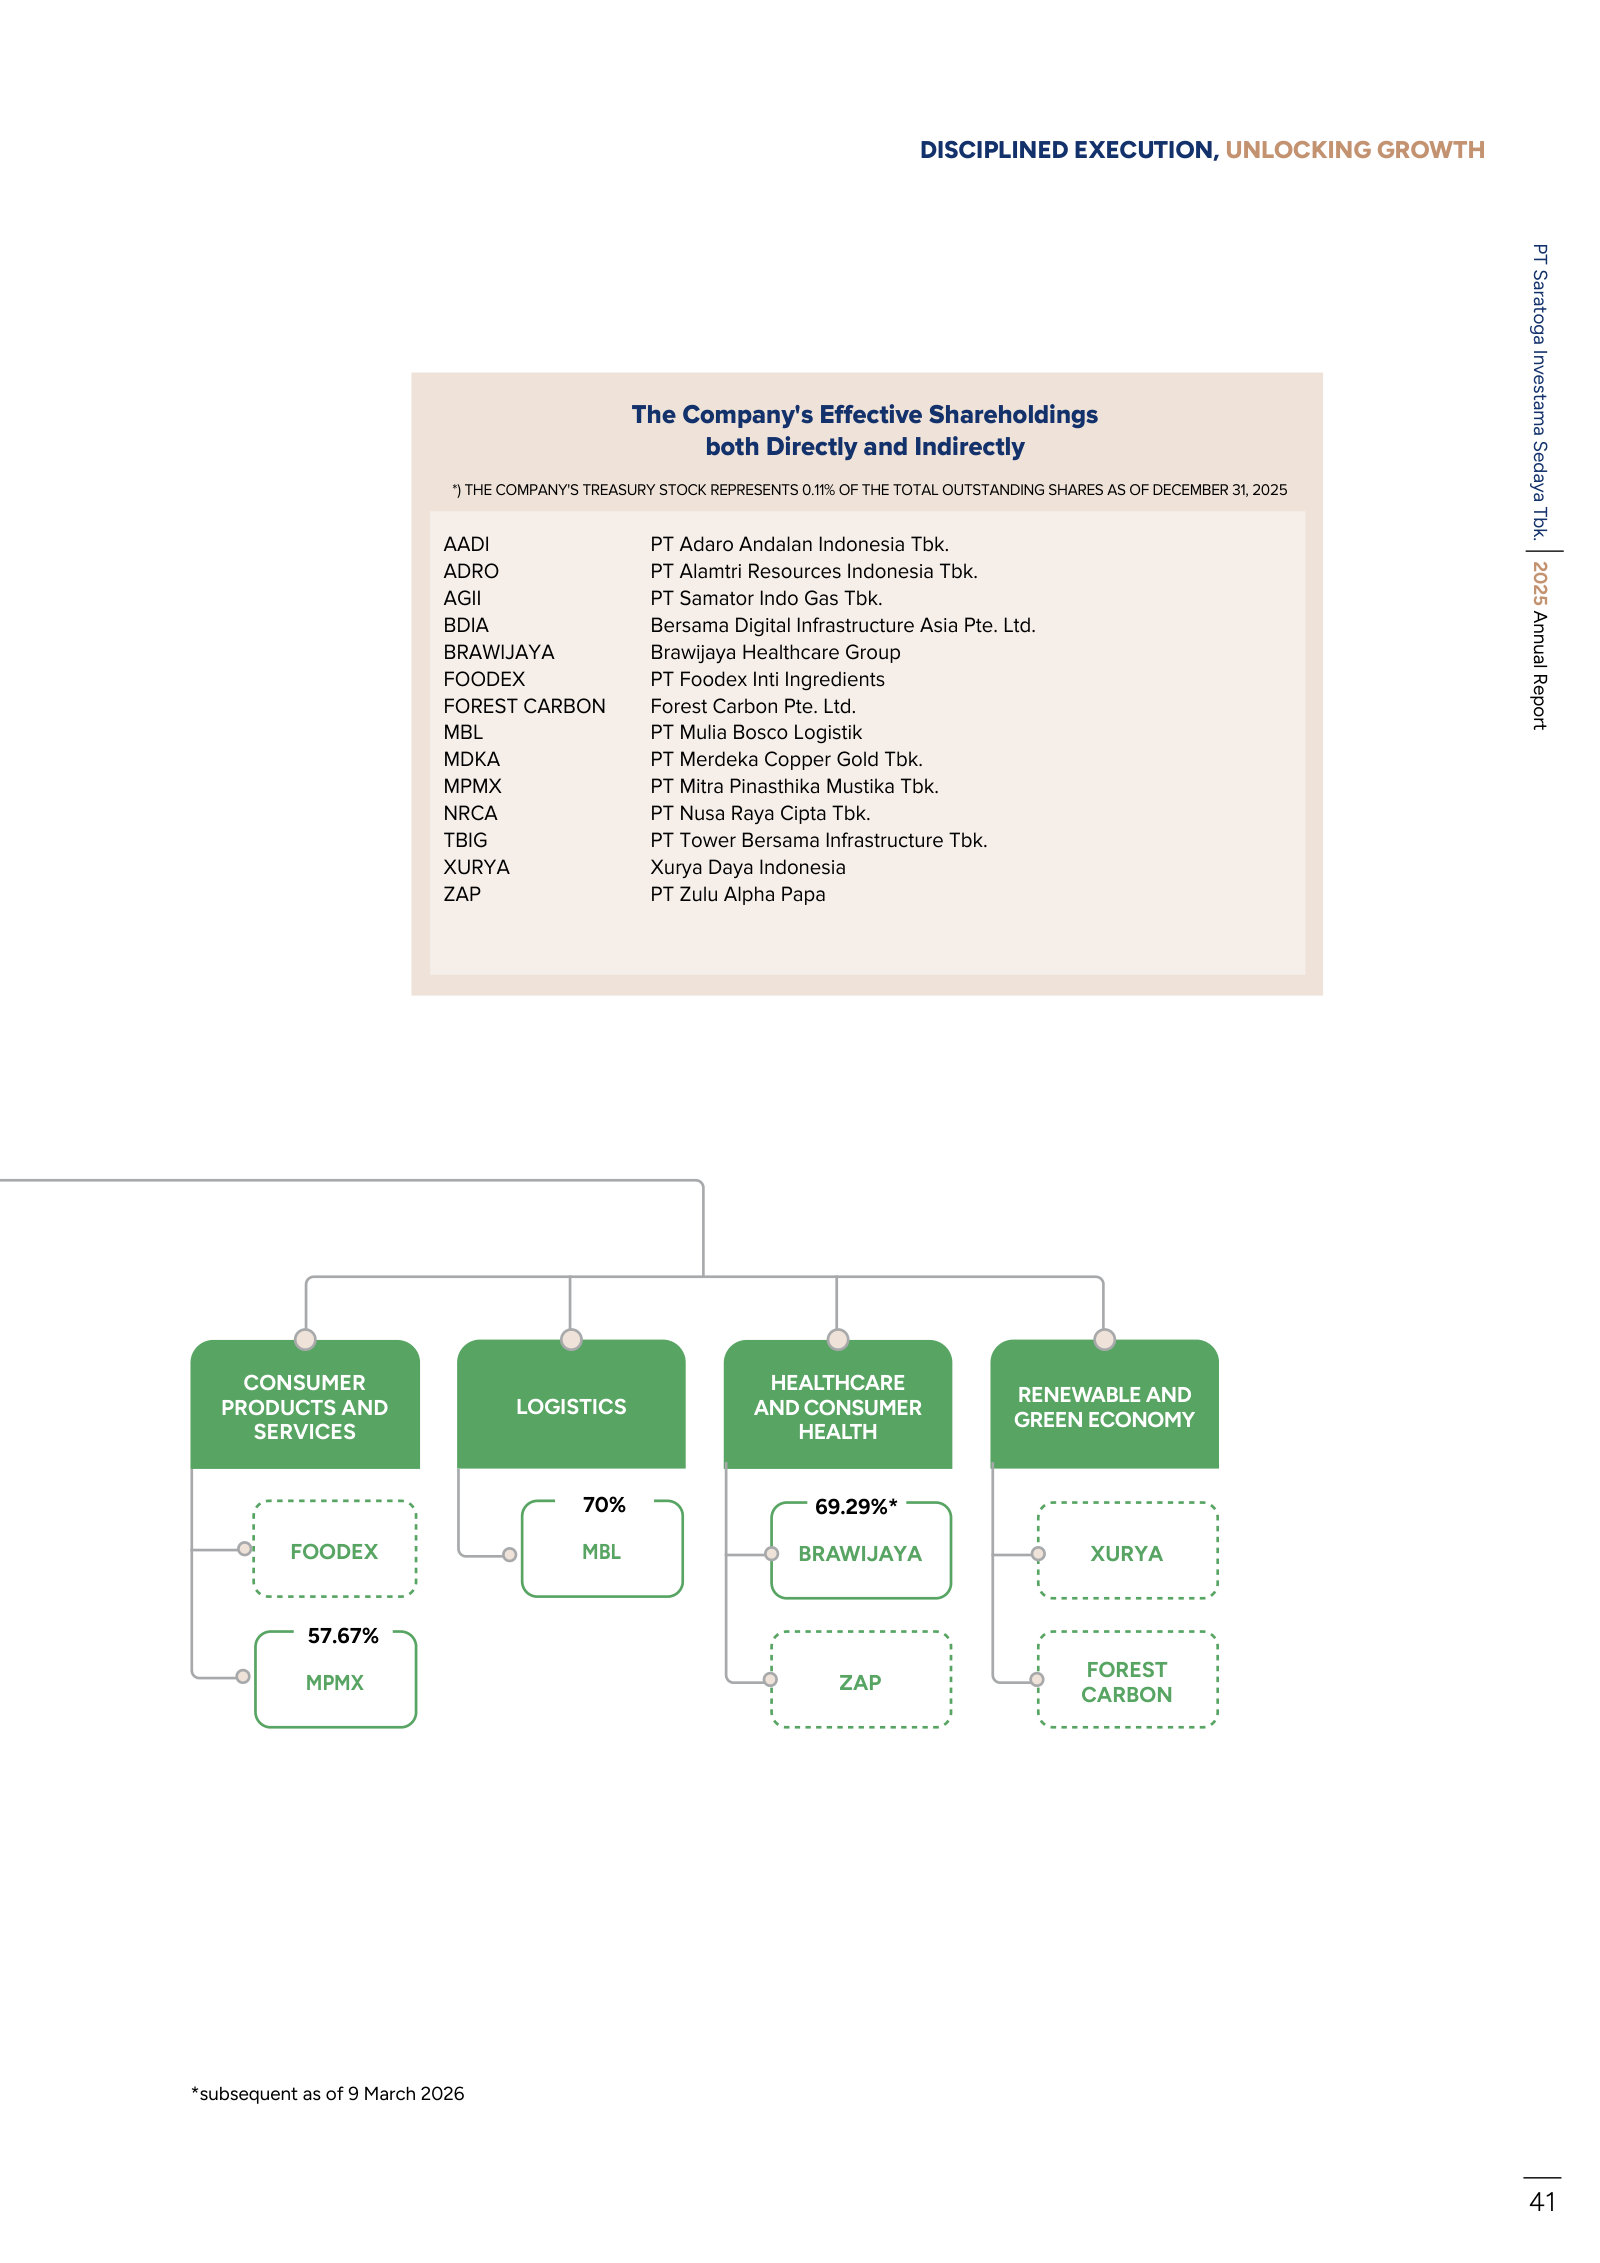
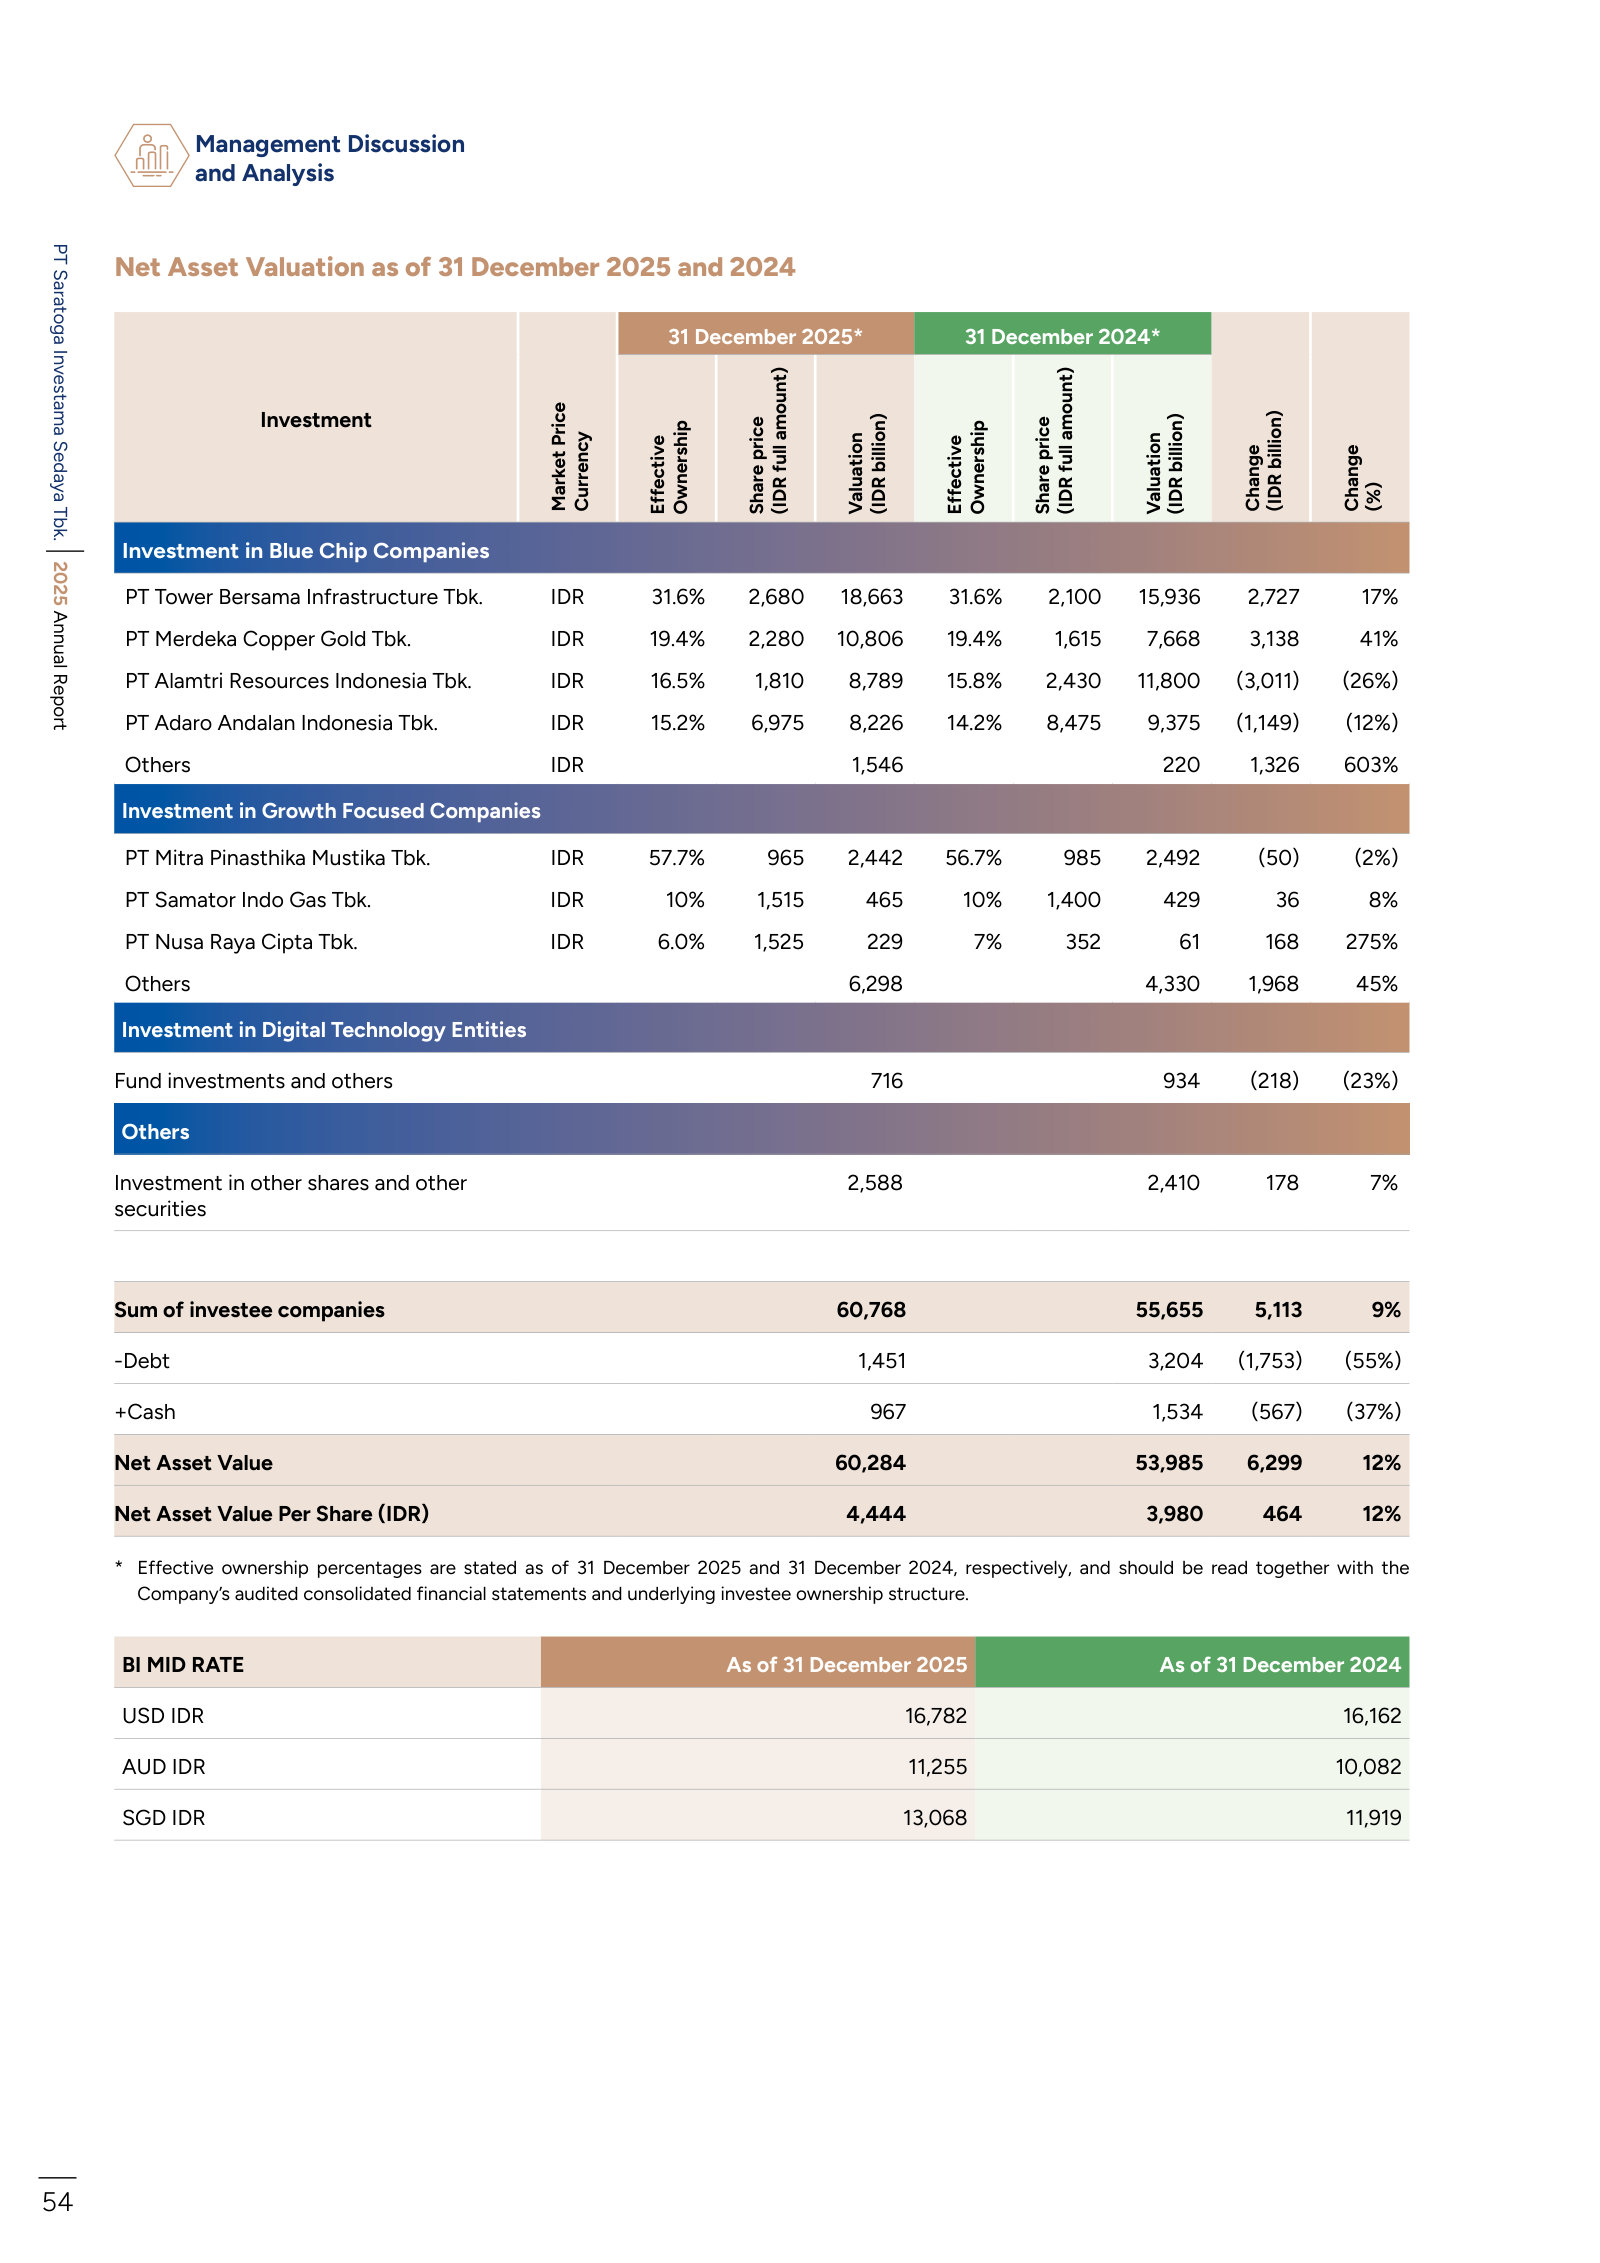
p. 6 — The FY2025 portfolio list — blue chip versus growth, with Foodex and Nusa Raya Cipta now in the growth column. · Open the full presentation →p. 8 — Net investing by year and the deal funnel: 99 opportunities screened in 2025, one term sheet, no new investments. · Open the full presentation →p. 9 — NAV of IDR 60.3tn in 2025 and dividend income by investee — ADRO's contribution halving as AADI's begins. · Open the full presentation →p. 10 — Investment milestones 2002–2016 with NAV per share overlaid — the first half of the track record, entries and exits by year. · Open the full presentation →p. 11 — The same timeline through 2025, ending on a year with no new names added. · Open the full presentation →p. 14 — Three-year balance sheet and P&L: IDR 62.5tn assets against IDR 3.6tn liabilities, and the swing from a 2023 loss to IDR 7.3tn profit. · Open the full presentation →p. 42 — The ownership map as of December 2025 — who owns Saratoga, and Saratoga's stake in each listed holding by sector. · Open the full presentation →p. 43 — The rest of the structure: the private holdings, including 69% of Brawijaya and 70% of Mulia Bosco. · Open the full presentation →p. 56 — The sum-of-the-parts: every investment at effective ownership and market price, less debt plus cash, to NAV per share of IDR 4,444. · Open the full presentation →
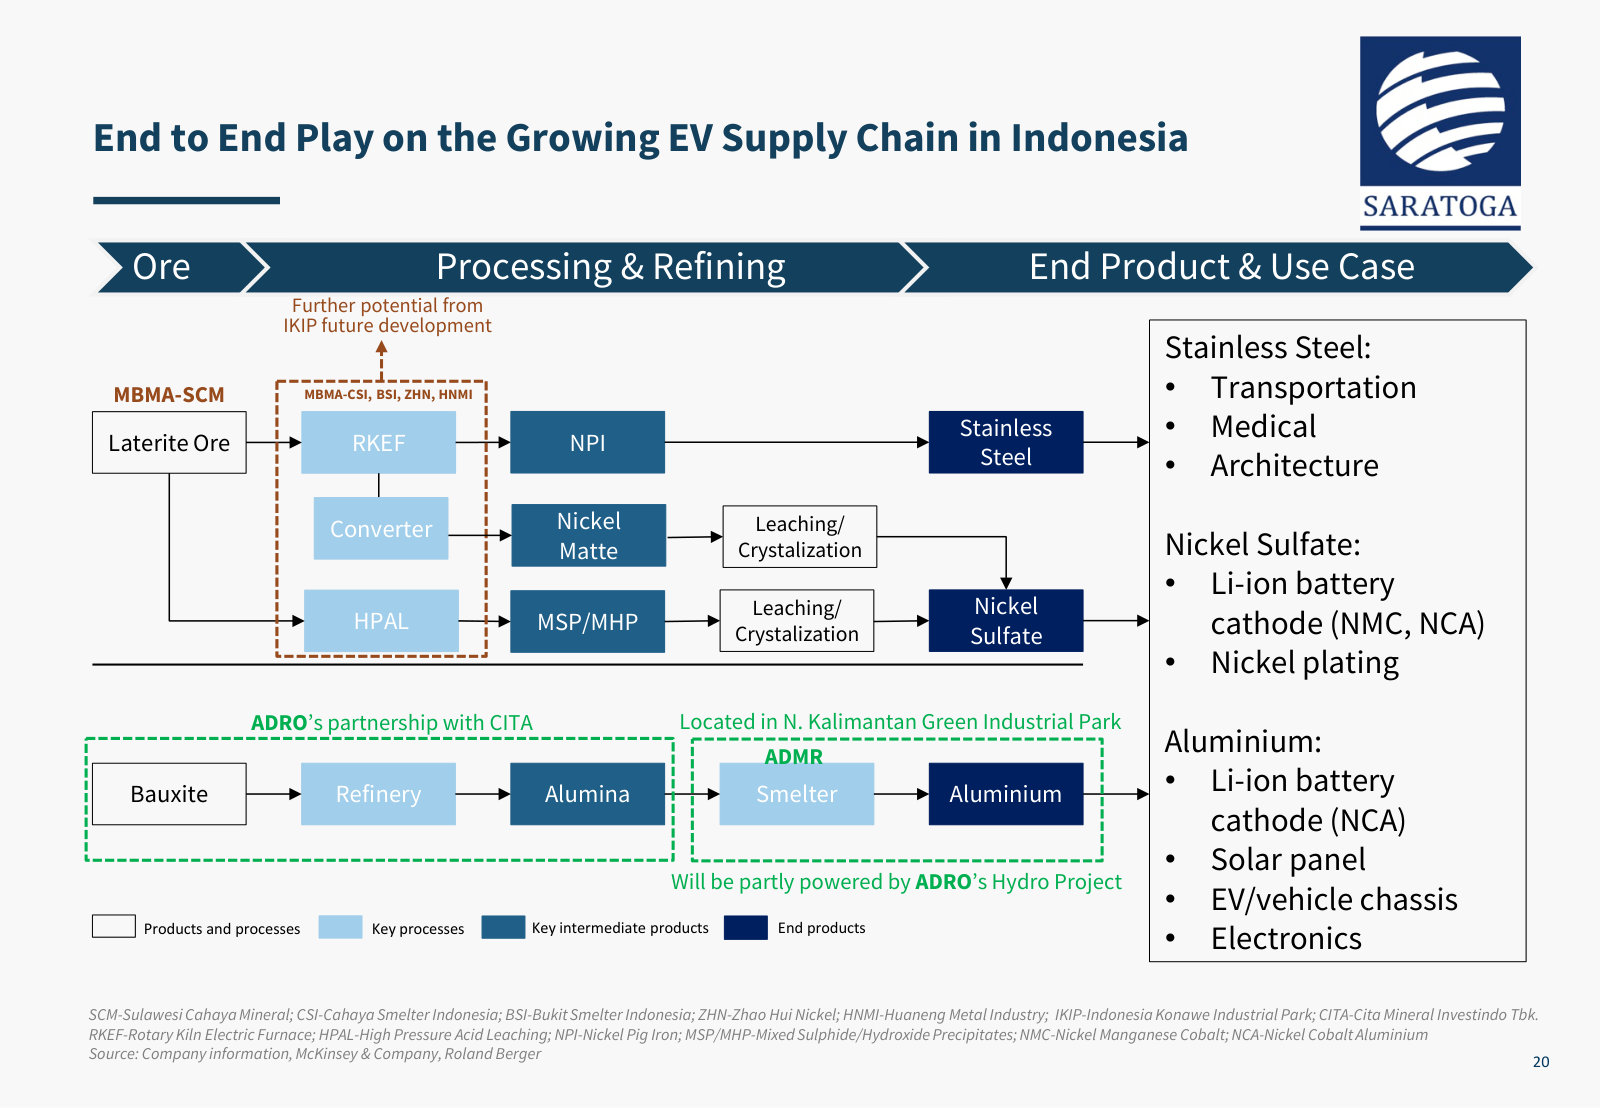
The core of this deck was superseded in January 2025, but its appendix — dropped from later editions — is the only place management maps the nickel and aluminium value chains its holdings sit in. · Open the full document →
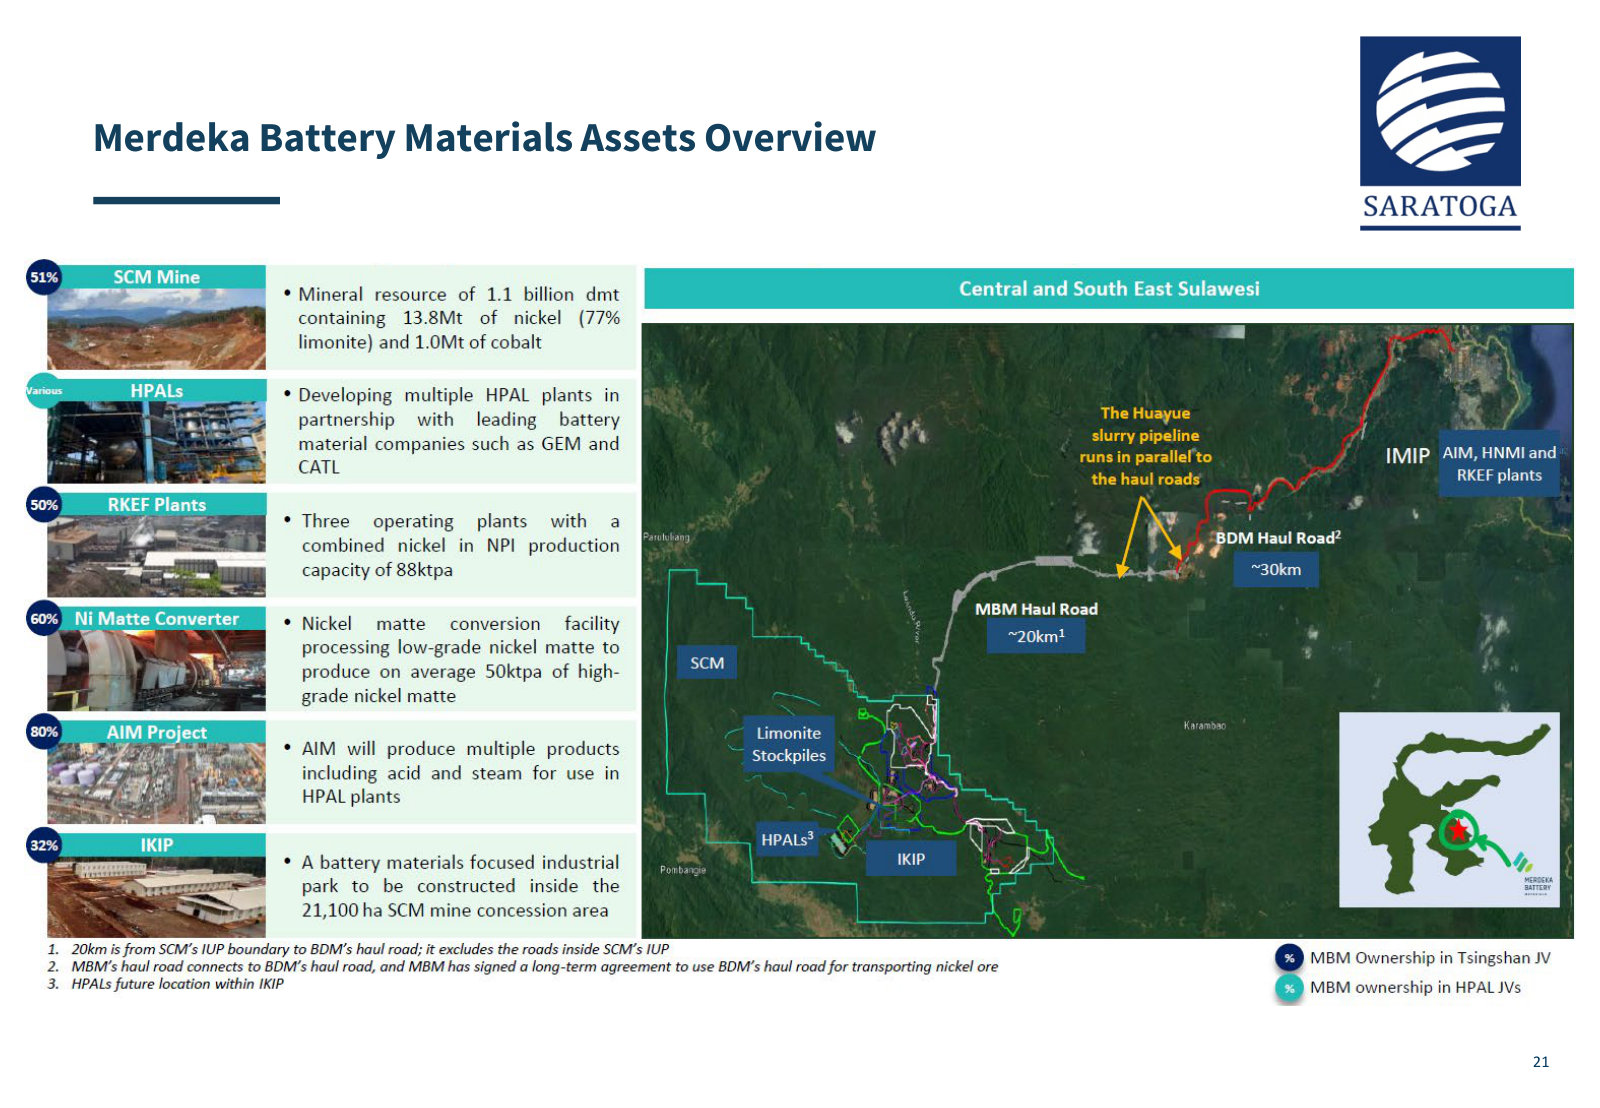
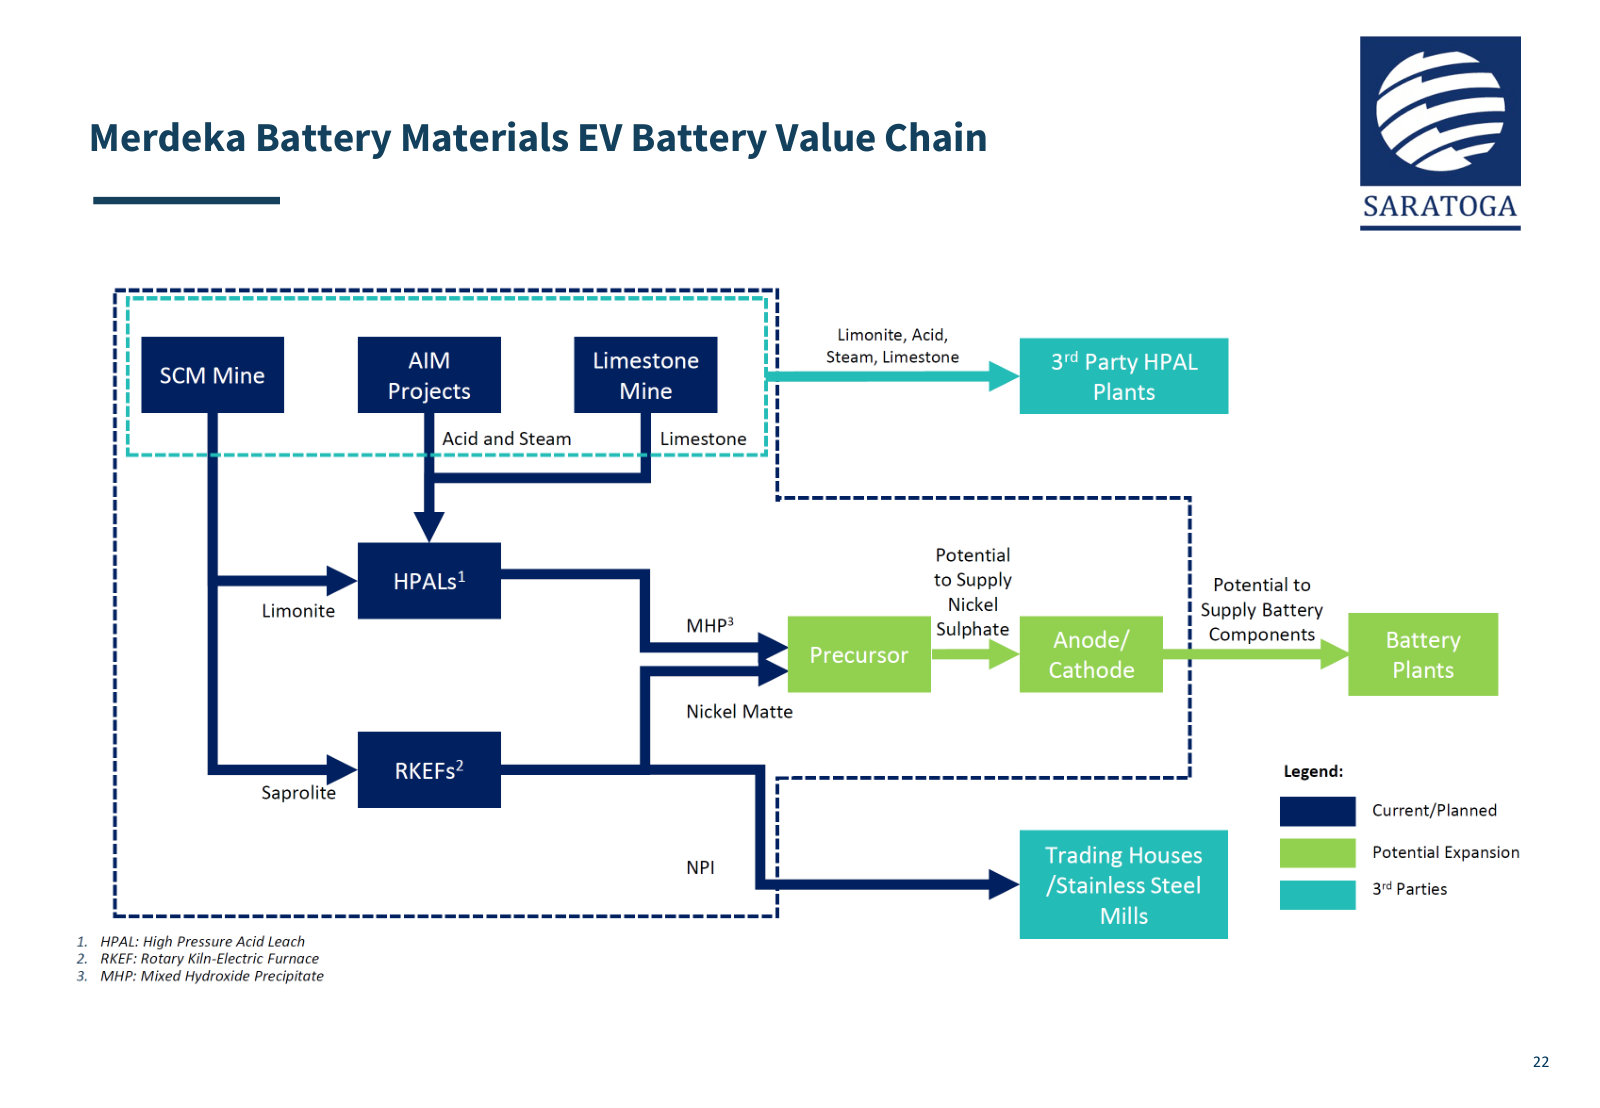
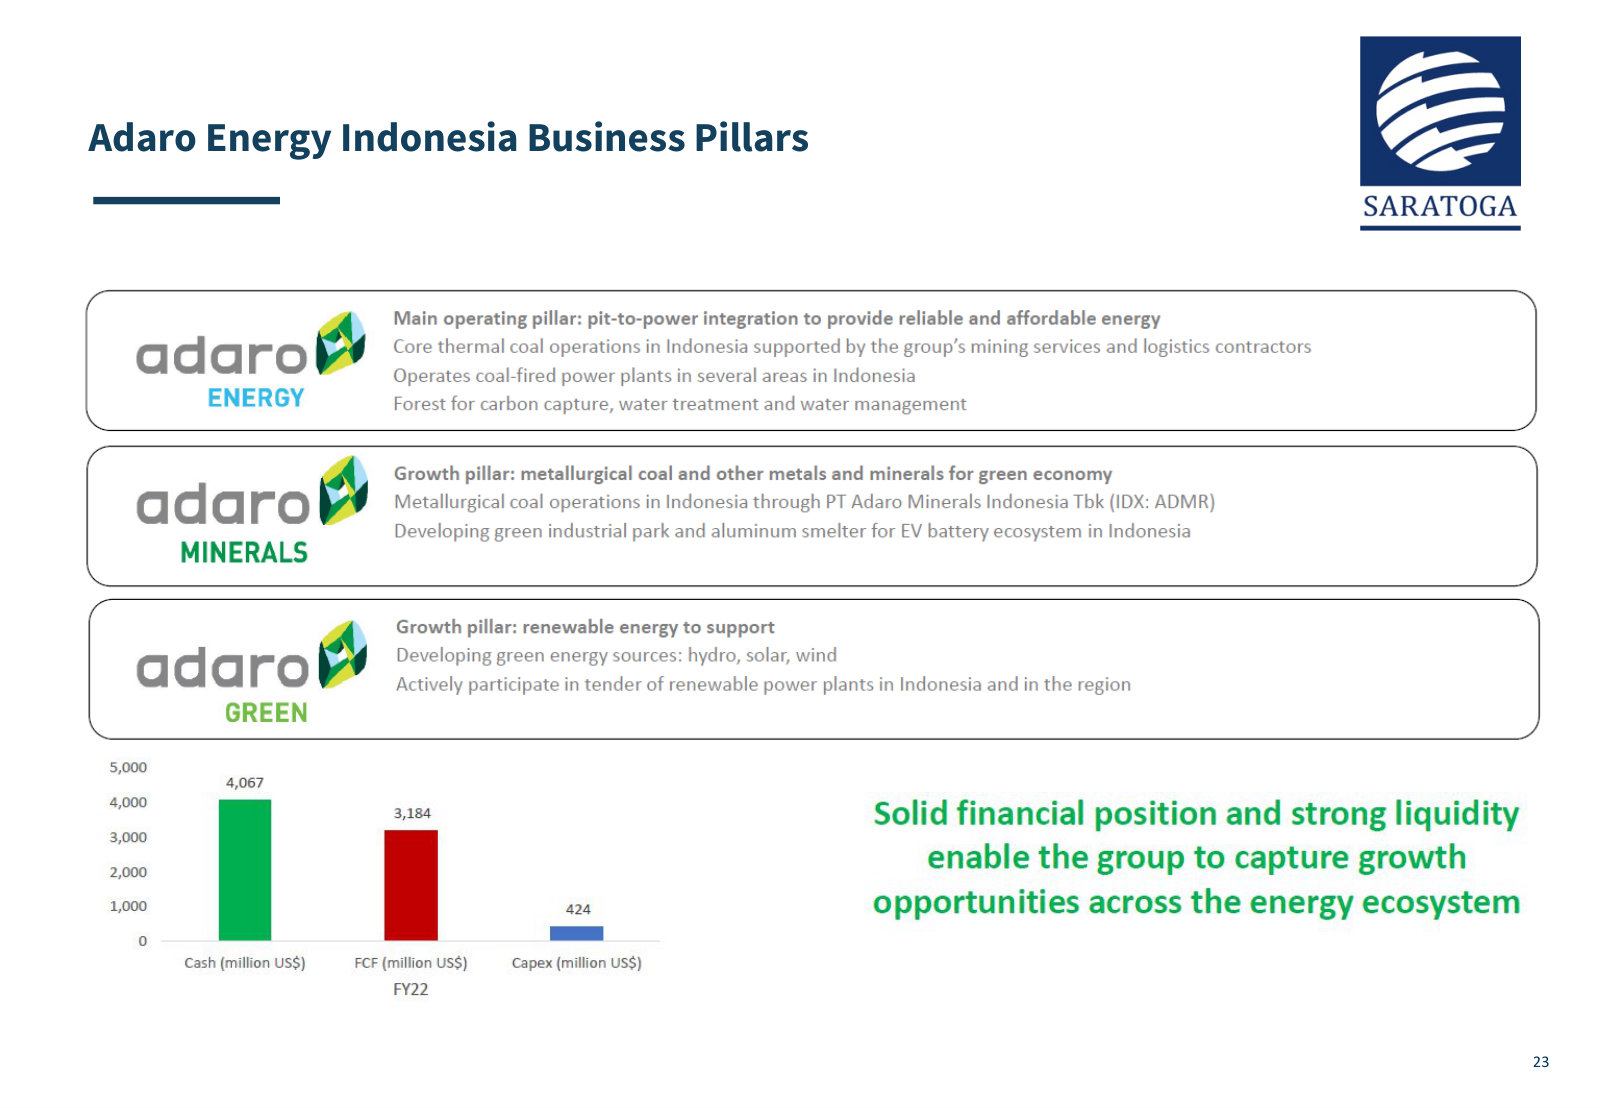
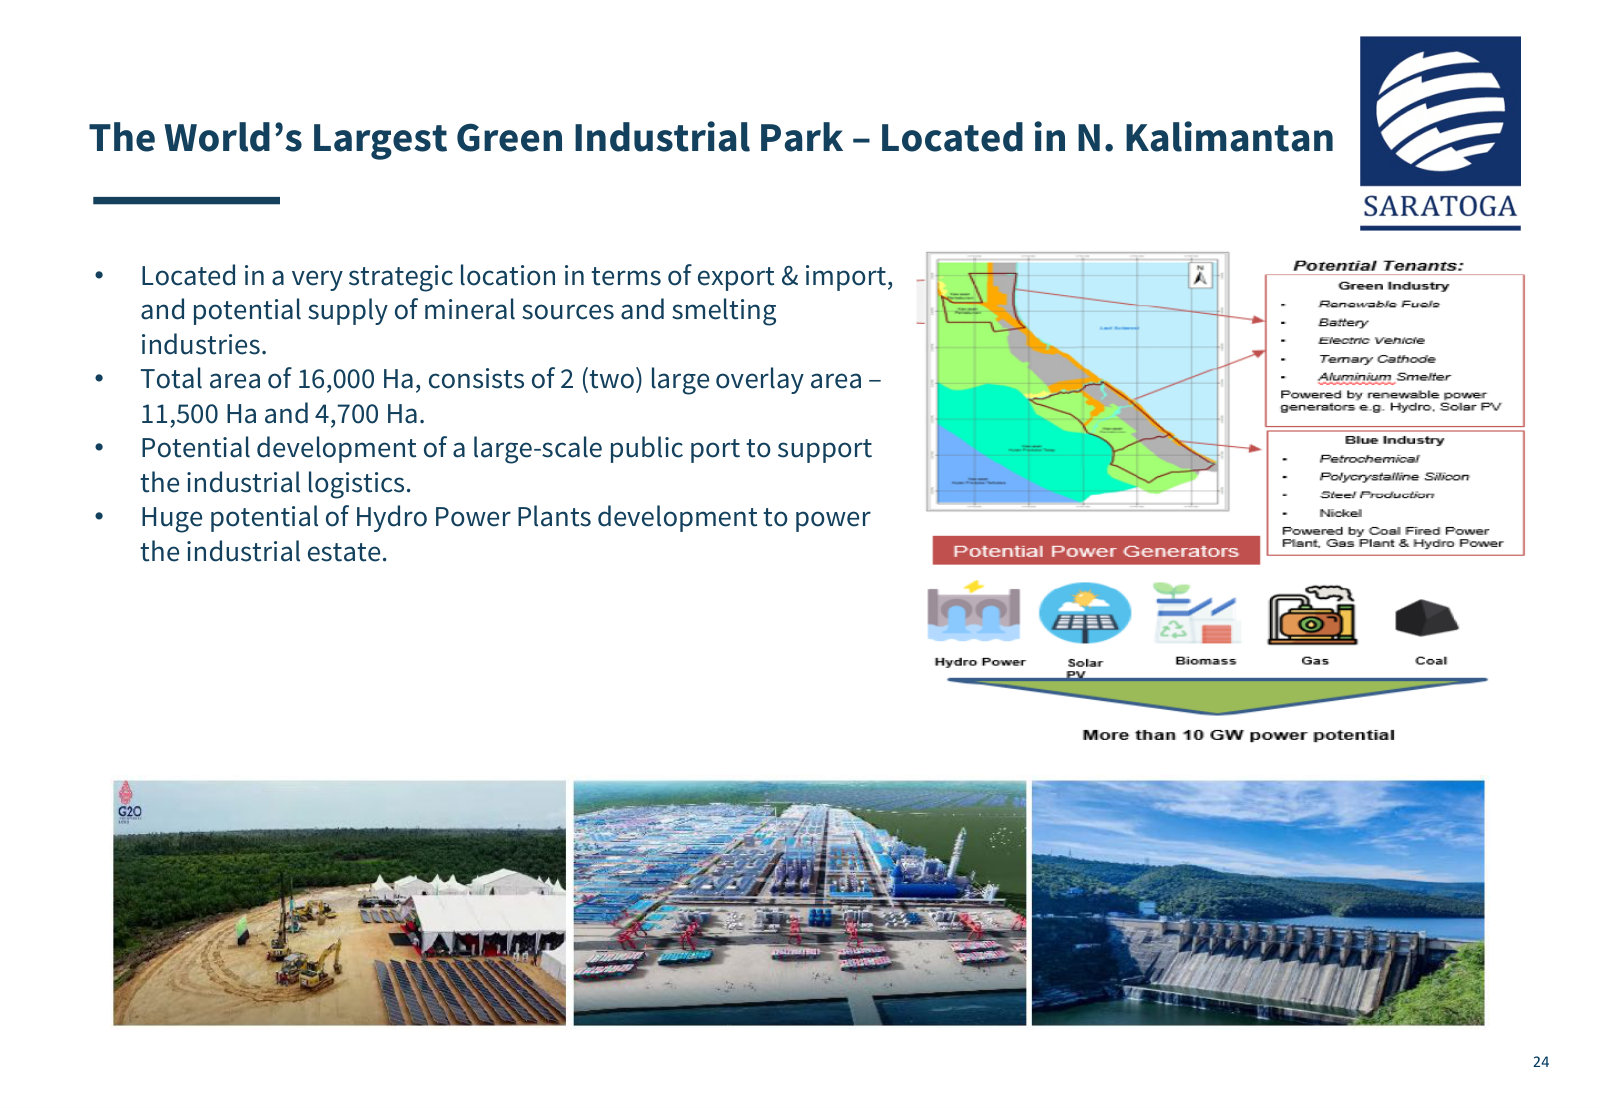
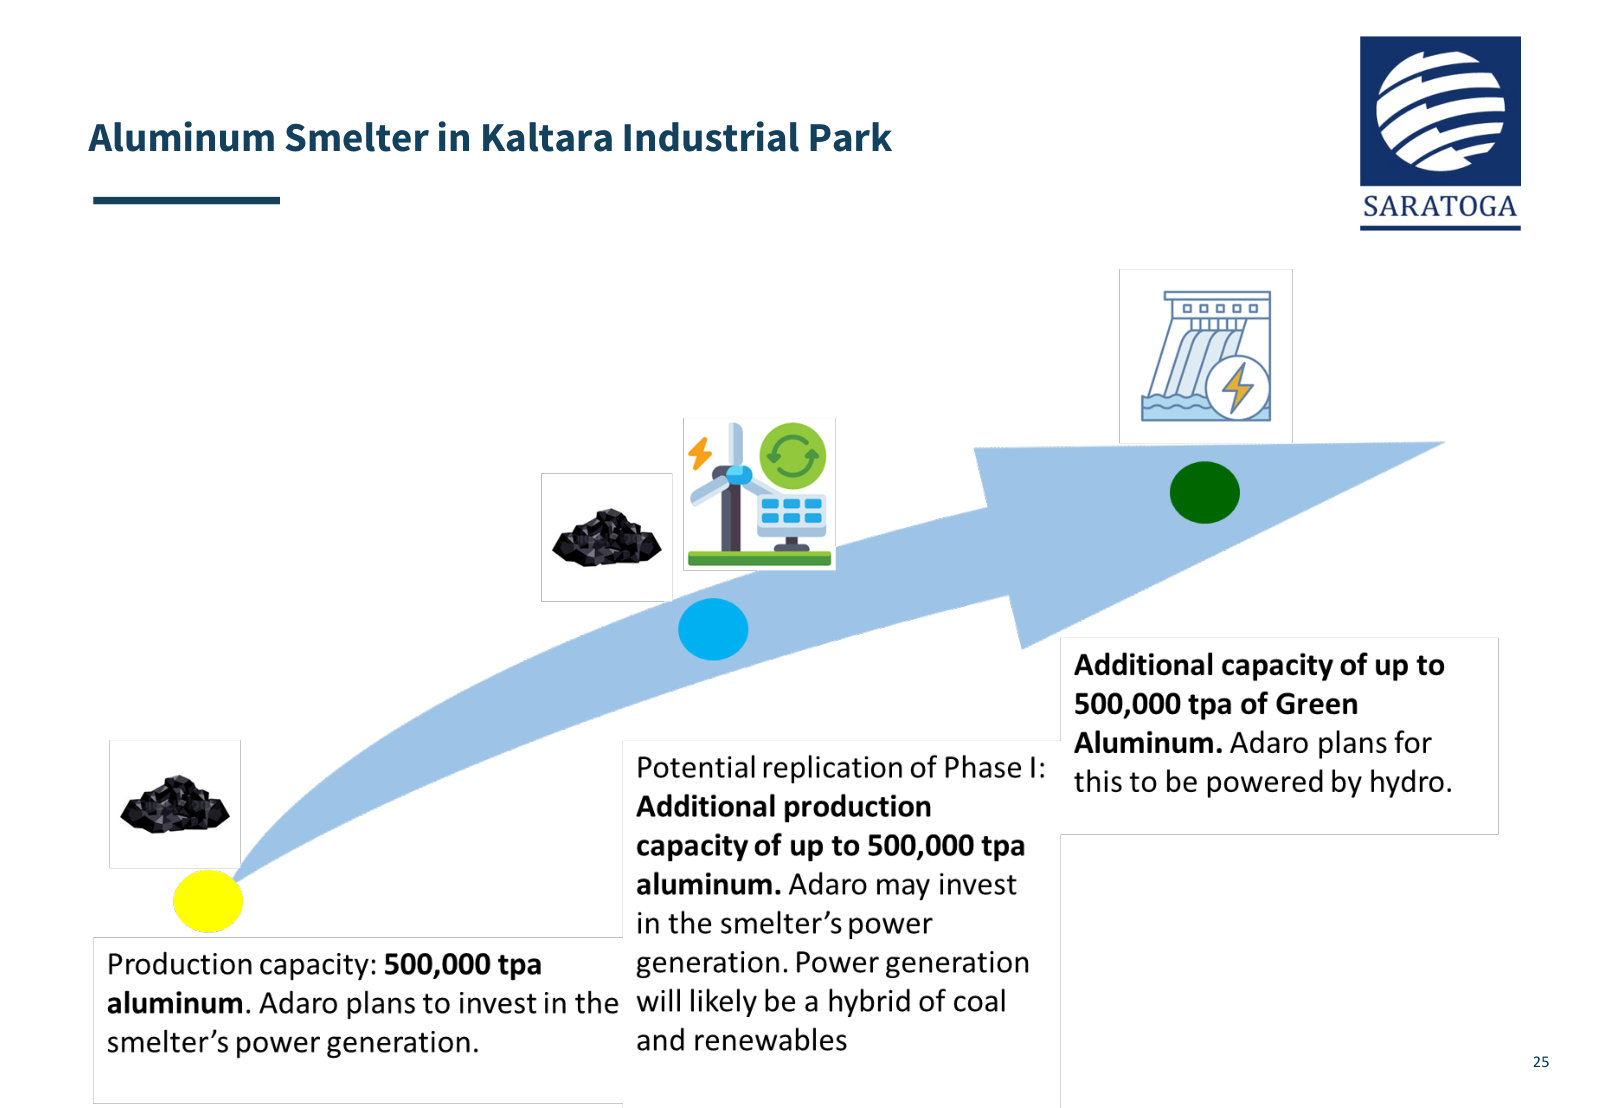
p. 20 — Ore to end product across the Indonesian EV supply chain, with each Saratoga holding placed on the chart. · Open the full presentation →p. 21 — Merdeka Battery Materials' assets in Sulawesi — mine, HPALs, RKEFs and haul roads, with ownership at each. · Open the full presentation →p. 22 — How MBMA's assets feed each other, and where the potential expansion into precursor and cathode would sit. · Open the full presentation →p. 23 — Adaro's three pillars — thermal coal, minerals, renewables — the split that preceded the 2024 ADRO/AADI separation. · Open the full presentation →p. 24 — The 16,000-hectare Kaltara green industrial park: target tenants and the power sources meant to serve them. · Open the full presentation →p. 25 — The aluminium smelter phased from coal-powered to hydro-powered — the downstream end of the Adaro thesis. · Open the full presentation →
AGM and EGM Material 2026 — 2026 · 27 pages · Management's own summary of FY2025 signed off for shareholders, plus the treasury-share and LTIP allocation put to the May 2026 vote. · Open →
AGM and EGM Material 2025 — 2025 · 47 pages · The full board slate reappointed in 2025 with candidate profiles, and the articles-of-association amendment passed alongside it. · Open →
Investor Presentation — August 2024 — August 2024 · 25 pages · The August edition of the same deck, on 1H24 figures — useful only to see what management was saying before the Brawijaya build-out. · Open →
AGM and EGM Material 2024 — 2024 · 31 pages · The FY2023 performance report and the buyback and treasury-share proposals put to shareholders after a year of NAV decline. · Open →
AGM and EGM Material 2023 — 2023 · 30 pages · The FY2022 report and the LTIP and share-buyback resolutions that set up the treasury-share programme still running today. · Open →